March 2008
In this Issue:
Two control charts used with counting type data are the c and u control charts. As with all control charts, we collect data and calculate the average and the control limits. The calculations are usually done with a software program. But did you know that the control limit equations for the c and u control charts are only valid under certain conditions? When the equations are not valid, they can not be used. This is called the small sample case for c and u control charts. This newsletter examines this small sample case and how the control limits are calculated. Last month’s publication examined the small sample case for p and np charts. It is available on our website.
c and u Control Charts
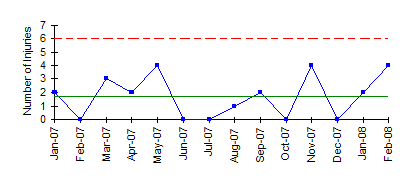
For example, suppose you are using a c control chart to track the number of recordable injuries in a plant on a monthly basis. The plant is the area of opportunity for injuries to occur. You collect data each month on the number of injuries (c). Once enough data is available, you calculate the average (cbar) and control limits (LCLc and UCLc). An example of a c control chart is shown below.
For more information on c control charts, please see our July 2004 newsletter that is available on our website. If the area of opportunity changes over time, the u control chart is used in place of the c chart.
Both these charts involve counts. You are counting items. To use a c or u control chart, the counts must also satisfy the following two conditions:
- You are counting c distinct items that occur within a well-defined area of opportunity.
- The counts are independent and proportional to the area of opportunity.
If these two conditions are met and the counts are rare, the Poisson distribution can be used to estimate the distribution of the counts and the c or u control charts can be used.
Control Limits
The control limits for the c control chart are given below.
where cbar is the average number defective, UCLc is the upper control limit and LCLc is the lower control limit.
The control limits for the u control chart are given below.
where ubar is the average number of defects per inspection unit, n is the number of inspection units, UCLu is the upper control limit and LCLu is the lower control limit.
These equations for the control limits are commonly used. However, these control limits are only valid under certain conditions. The basic probability distribution for the calculation of control limits for the c and u charts is the Poisson distribution. Under certain conditions, the Poisson distribution is symmetrical and the control limits for the c and u control charts are those given above.
Suppose you have a process that is in statistical control with an average number of defects of cbar. Since the process is in control, any c values obtained should fall between the control limits in a random fashion. The chance that c will fall outside the control limits is approximately 3 out of 1,000. These control limits are good as long as cbar is sufficiently large. In these cases, the Poisson distribution is symmetrical and the equations above provide good estimates of the control limits.
Poisson Distribution
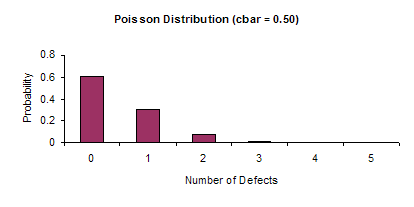
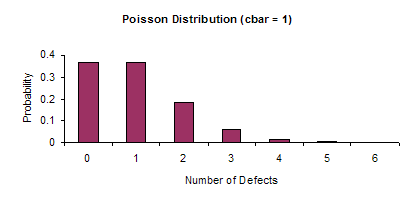
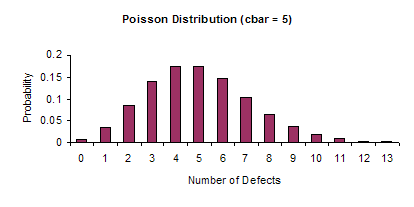
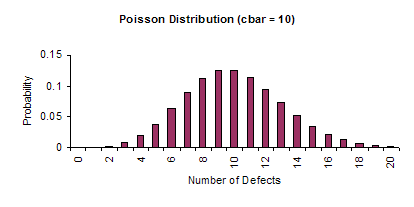
The c and u charts are based on or approximated by the Poisson distribution. If c is sufficiently large, the Poisson distribution is symmetrical and approaches the shape of a normal distribution. In these cases, the equations for the control limits on the c and u chart are valid. However, if c is small, the Poisson distribution is not symmetrical and the equations are no longer valid. The figures below demonstrate how the shape of the Poisson distribution changes as cbar increases from 0.5 to 10.0. It is easily seen that it moves from a non-symmetrical shape to a symmetrical shape.
Small Sample Case
If cbar < 2, the control limit equations are not valid. In these cases, the control limits must be derived from the Poisson distribution. We have generated the table below that gives you the control limits in this small sample case. It covers cbar values from 0.02 to 2.48. This goes beyond the small sample case of cbar < 2, but represents limits derived from the Poisson Distribution and not the control limit equations. There is no lower control limit for the cbar values considered.
| cbar | UCL |
| 0.01 to 0.08 | 2 |
| 0.09 to 0.28 | 3 |
| 0.29 to 0.60 | 4 |
| 0.61 to 0.99 | 5 |
| 1.00 to 1.44 | 6 |
| 1.45 to 1.94 | 7 |
| 1.95 to 2.48 | 8 |
The control limits are determined with the assumption that the probability of obtaining a point beyond the control limit is less than or equal to 0.003:
P(c <= LCLc) + P(c >=UCLc) <= 0.003
To understand how to use the equation, consider the following example. Suppose you are charting the number of injuries in a plant and that cbar = 0.20. To determine the control limits, look up cbar = 0.20 in table above. In this case, the UCL is 3.
The control limits in the table were obtained using the Poisson function in Microsoft Excel. For this example, the probabilities have been calculated and are shown below.
| Defects | Probability | Cumulative Probability |
| 0 | 0.8187 | 0.8187 |
| 1 | 0.1637 | 0.9824 |
| 2 | 0.0164 | 0.9988 |
| 3 | 0.0011 | 0.9999 |
Thus, the probability of obtaining 0 defects is 819 out of 1,000. The probability of obtaining 0 or 1 defect is 982 out of 1,000. The probability of obtaining 0, 1, or 2 defects is 999 out of 1,000. Note that even though this is larger than 997 out of 1,000, the upper control limit is 3. This is because the probability of obtaining 2 defects is 16 out of 1,000. The control limits are set so that the probability of obtaining a point beyond the control is less than or equal to 3 out of 1,000.
The control limits in the table are for the c chart. To convert the numbers to a u chart format, use the following relationships:
UCLu = UCLc/n
LCLu = LCLc/n
ubar = cbar/n
Summary
This newsletter examined the small sample case for c and u charts. When the average number of defects gets small, the control limit equations are no longer valid and the control limits must be determined from the Poisson distribution. A table was provided to give you the control limits in these cases. In reality, when the average number of defects gets very small, you should begin to look at alternative methods of charting the data. One possible method is the chart for rare events (see our May 2007 newsletter).
