May 2015

So, a hypothesis is just a statement of theory. It may or may not be true. A drug company can claim that a new drug is better at decreasing blood pressure. You may claim that the diet plan you created helps people lose more weight than a nationally known diet plan. All these things are just statements – just hypotheses.
The hypothesis is the starting point. From there, we have to test the hypothesis and reach a decision if the hypothesis is probably true or probably false. Note the word “probably.” There is always variation – so there is always a chance for you to make the wrong decision. This month’s publication takes a look at the five steps involved in conducting a hypothesis test.
In this issue:
- The problem
- A brief pause for the standard normal distribution
- Formulate the null hypothesis and the alternative hypothesis
- Determine the significance level
- Collect the data and calculate the sample statistics
- Calculate the p value for the hypothesis test
- Compare the p value to the desired significance level
- Summary
- Quick Links
You can download this publication as a pdf here.
The Problem

The average coating thickness is 5 mil. You want to be sure that the coating thickness remains the same before you will approve the process change.
The team wants to perform a hypothesis test to prove that the average coating thickness will not change. The team will go through the basic five steps of hypothesis testing:
- Formulate the null hypothesis and the alternative hypothesis
- Determine the significance level
- Collect the data and calculate the sample statistics
- Calculate the p value for the hypothesis test
- Compare the p value to the desired significance level
The details of the five steps are shown below. However, before those steps are covered, a review of the standard normal distribution is needed. This will be required when we do some calculations.
A Brief Pause for the Standard Normal Distribution
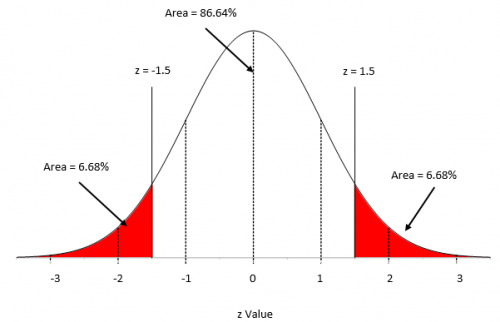
We need to digress a moment here because we will need to make use of a special case of the normal distribution – when the average = 0 and the standard deviation = 1. This special case is called the standard normal distribution and is shown in Figure 1.
Figure 1: Standard Normal Distribution
For this distribution, the area under the curve from -∞ to +∞ is equal to 1.0. In addition, the area under the curve is proportional to the fraction of measurements that fall in that region. These two facts can used to help determine the fraction of measurements that fall above some value (such as a specification limit), below some value, or between two values.

z= (x- μ)/σ
where x is some value, μ is the average, and σ is the standard deviation of the x values. The value of z (the z score) is simply how many standard deviations a value, x, is from the average.
For example, suppose x is 1.5 standard deviations below the average. In this case, z = -1.5. The area below z = -1.5 is the percentage of x values that are more than 1.5 standard deviations below the average. For z = -1.5, that area is 6.68% as is shown in Figure 1. If z = 1.5, then the area above z = 1.5 is the percentage of x values that are more than 1.5 standard deviations above the average. This area is also 6.68%.
To find the percentage of data within z = -1.5 and z = 1.5, you simply use the fact that the area under the curve is 100%, so the percentage of data between the two z values is 100 – 6.68 – 6.68 = 86.64%. You can determine these percentages from a table of z values (see our publication on the normal distribution) or by using Excel’s NORMSDIST function.
These percentages can also be viewed as probabilities, e.g., the probability of getting a result that is less than -1.5 standard deviations below the average is 0.0668. We will make use of this knowledge below. Now back to the steps in hypothesis testing.
Step 1: Formulate the Null Hypothesis and Alternative Hypothesis

So the null hypothesis (H0) is that the process change will not impact the average coating thickness; the average coating thickness (μ) will remain at 5. This is usually written as:
H0 = 5
Now for the alternative hypothesis, which is denoted by H1. The alternative hypothesis is that the process change will have an effect on the average coating thickness and the average coating thickness will not equal 5. This is usually written as:
H1 ≠ 5
This is called a two-sided hypothesis test since you are only interested if the mean is not equal to 5. You can have one-sided tests where you want the mean to be greater than or less than some value.
Step 2: Determine the Significance Level You Want
The significance level is important in hypothesis testing. It is the probability of rejecting the null hypothesis when it is true. This probability is denoted by α. Typical values of α include 0.05 and 0.01. You decide that you want α to be 0.05. This means that there is only a 5% of chance of rejecting the null hypothesis when it is actually true.
Step 3: Collect the Data and Calculate the Sample Statistics

X = average coating thickness = 5.06
s = standard deviation of the coating thickness = 0.20
We have our statistics. How do you decide to accept or reject the null hypothesis? The way you do this is to assume that the null hypothesis is true and then determine the probability (p value) of getting this sample average. If the p value is large, it means that there is large probability of getting an average thickness of 5.06 with a standard deviation of 0.20 when the null hypothesis is true and you will accept that the null hypothesis is probably true. But if the probability of getting these statistics is small, you will assume that the null hypothesis is probably not true and reject it in favor the alternative hypothesis.
Step 4: Calculate the p Value
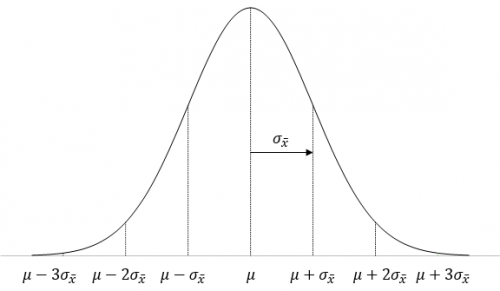
To determine this probability, you will need to consider your sampling distribution. The distribution of sample averages tends to be normal when the sample size is large enough. We will use this assumption here. So, your sampling distribution is represented by all the possible sample averages of sample size 25 from the population of coating thicknesses. This normal distribution is shown in Figure 2.
Figure 2: Normal Distribution for Sample Averages
The highest point on the curve is the average. The population average of the sample averages (μX ) is equal to the population average, μ, so we have just used μ in Figure 1. The standard deviation of the sample averages is denoted by σX.
To be able to draw your sampling distribution, you need to know μX and σX. Since you assumed that the null hypothesis is true, μX = 5.0. The standard deviation of the sample averages is given by:
σX =σ/√n
where σ is the population standard deviation and n is the sample size.
You don’t know what the population standard deviation is, but you have an estimate from the sample statistics. The standard deviation of the 25 samples was 0.2. You can use this as the population standard deviation.
σX =σ/√n = s/√n=0.2/√25=0.04
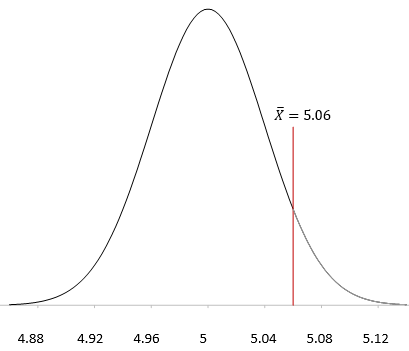
Now you can draw the sampling distribution and add the sample average as shown in Figure 3.
Figure 3: Sampling Distribution

Now we return to the z score. Remember, the z score is a measure of how many standard deviations the sample average (X )is from the population average (μ). For this example, the z value is calculated as:
z= (X-μ)/σX =(5.06-5)/.04=.06/.04=1.5
So, 5.06 is 1.5 standard deviations away from the average. As shown above, the probability of getting a result that is 1.5 standard deviations away from the average is 0.0668. Remember, this a two-side test, so you didn’t care if the difference was above or below the average. So, the probability of getting an average that is more than 1.5 standard deviations away from the average is 2(0.0668) = 0.1336 or 13.36%. This is the p value:
p value = 0.1336
Remember what the p value represents. You assumed that the null hypothesis is true. The p value is the probability of getting this result (or a more extreme result) if the null hypothesis is true.
Step 5: Compare the p value to the Desired Significance Level
In step 2, we set the significance level at 0.05. Since our p value is greater than this, we conclude that the coating thickness was not impacted by the process change. We accept the null hypothesis as probably being true. If the p value had been less than 0.05, we would rejected the null hypothesis and said that the process change did impact the coating thickness.
Summary
This newsletter has taken a look at how to perform hypothesis testing. The five steps are:
- Formulate the null hypothesis and the alternative hypothesis
- Determine the significance level you want
- Collect the data and calculate the sample statistics
- Calculate the p value for the hypothesis test
- Compare the p value to the desired significance level
The normal distribution was used to demonstrate how hypothesis testing is done. You will not always be dealing with the normal distribution but the process is essentially the same. One item that is still to be discussed is how to select the sample size. This will be the subject of a later publication.


