July 2009
In this issue:
Introduction
We are quite often faced with answering the following question:
Are these processes the same?
For example,
- Do these suppliers provide us with the same product?
- Do these reactors produce the same product?
- Do these shifts operate the same?
The first step in answering this type of question is to determine what the “same” means. Suppose we have five product lines that make the “same” product. One key product characteristic is the weight of the product. The products are the “same” from each line if each line produces product that has the same average weight and the same variation (standard deviation). In addition, the shape of the variation around the average (the histogram) must the same.
Of course, the five product lines will not make product that has the same average weight and the same variation about that average weight. This is because everything varies. Common cause of variation is always present in all our processes. For more information on common and special causes of variation, please see our January 2008 newsletter.
So, when we calculate an average weight for each of the five product lines, these will not be the same. This is also true if we calculate the standard deviation for each product line. They will not be identical. So, we have two questions to consider.
- How do we determine if the processes are the same?
- Does statistical control (i.e., common and special causes) play a role in making this decision?
Many times only question 1 is addressed. The answer to question 2 is also very important. This month’s newsletter provides answers to these two questions.
Question number one really has two parts:
- Are any of the treatment means significantly different than another treatment mean?
- Are any of the treatment variances significantly different than another treatment variance?
Our January 2009 newsletter demonstrated how Bonferroni’s method can be used to determine if any of the treatment means are significantly different.
In this newsletter, we will explain how to determine if any treatment variances are significantly different. We will use a technique called Bartlett’s test to determine this.
Bartlett’s Test for Equality of Variances
The Bartlett test performs the following hypothesis test for our five product lines. The null hypotheses is that the variance is the same for all product lines. The alternate hypothesis is that the variances are different for at least two product lines.
![]()
To determine if these product lines produce products with the “same” weight, you decide to randomly take four samples from each product line. Bartlett’s Hypothesis test sample is weighed and the weight (grams) recorded. The data is shown below.
| Line A |
Line B |
Line C |
Line D |
Line E |
| 250 | 310 | 250 | 340 | 250 |
| 260 | 330 | 230 | 270 | 240 |
| 230 | 280 | 220 | 300 | 270 |
| 270 | 360 | 260 | 320 | 290 |
The first step is to calculate some summary statistics. These are shown below.
| Line A |
Line B |
Line C |
Line D |
Line E |
|
| 250 | 310 | 250 | 340 | 250 | |
| 260 | 330 | 230 | 270 | 240 | |
| 230 | 280 | 220 | 300 | 270 | |
| 270 | 360 | 260 | 320 | 290 | |
| Count | 4 | 4 | 4 | 4 | 4 |
| Average | 252.5 | 320.0 | 240 | 307.5 | 262.5 |
| Sigma | 17.078 | 33.665 | 18.257 | 29.861 | 22.174 |
| Variance | 291.667 | 1133.333 | 333.333 | 891.667 | 491.667 |
| Log(Variance) | 2.4649 | 3.0544 | 2.5229 | 2.9502 | 2.6917 |
We will use the log of the variance in the calculations below. The steps in using Barlett’s test for equality of variances are given below. Note that if you do some of the calculations by hand, there be slight differences due to rounding. We will calculate a “Bartlett Test Statistic.” This statistic is then compared to a chi-square value to determine if it is significant.
Step 1: Calculate the pooled variance (Sp2)
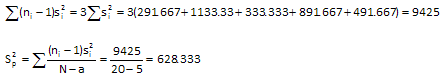
where:
ni = number of samples for the ith treatment (constant in this example at 4)
si2 = variance of the ith treatment
N = total number of samples (20)
a = total number of treatments (5)
Step 2: Calculate q
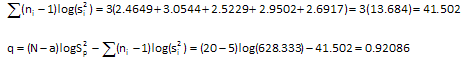
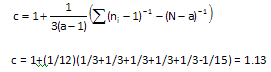
Step 3: Calculate c
Step 4: Calculate Bartlett Test Statistic
![]()
Step 5: Determine if the test statistic is significant
There are two ways to do this. One way is to determine the critical chi-square value for the confidence you want and the degrees of freedom. Suppose you want alpha = 0.05. There are a – 1 = 5 -1 = 4 degrees of freedom. You can look up the critical value of chi square in a statistical table or you can use the CHIINV function in Excel. The critical value of chi square is 9.488.
If the Bartlett test statistic is greater than this critical value, there is a significant difference in the variances. If the Bartlett test statistic is less than this critical value, there is not a significance difference. In this example,
X02 < 9.488
So, we conclude there is not a significant difference in the variances. All five product lines have the same variance.
We could also calculate the probability associated with Bartlett test statistic. You can do this in Excel using the CHIDIST function. The probability is 0.76. Since this is larger than 0.05, we conclude that the variances are the same.
Impact of Special Causes on Bartlett’s Test
Now suppose we change the first sample under B from 310 to 100.
| Line A |
Line B |
Line C |
Line D |
Line E |
| 250 | 100 | 250 | 340 | 250 |
| 260 | 330 | 230 | 270 | 240 |
| 230 | 280 | 220 | 300 | 270 |
| 270 | 360 | 260 | 320 | 290 |
We can then rerun the calculations. In this case, we discover the following:
Bartlett’s Test Statistic: 16.483
Critical Chi-Square Value: 9.488
p Value: 0.0024
Since the test statistic is greater than the critical value for chi-square, we conclude there is a significant difference in the variances. The p-value is also less than 0.05 which confirms this.
The tendency here is to assume that the variances are truly different. However, many statistical tests (comparing two means, Bartlett’s test, Bonferroni’ test, etc) only have meaning if the processes that produce the data are in statistical control. If the processes are not in statistical control, you can not be sure that you will get the same results if you repeat the experiment. If you construct an R chart based on the product line data, you will get the chart below.
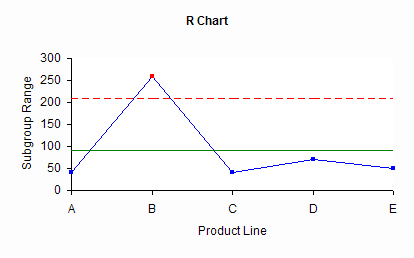
There is an out of control point for the sample taken from product line B. This tells you that there is special cause of variation present in the data. Perhaps line B is really does have significantly higher variation than the other lines. But by examining the raw data, you can see that the value of 100 does appear to be an outlier. There is really no difference in the variance of the five product lines – just a special cause of variation with that one sample. Once again, remember that special causes can affect any experiment you do. Always plan, if possible, on checking for the special causes of variation.
Summary
This newsletter showed how to use Bartlett’s method to compare the variances from several processes. Calculations are performed to determine if the variances are the same. Like all tests to compare processes, you should be aware that the presence of special causes can impact the results.