September 2006
In this issue:
Last month we looked at ways to compare the averages from two processes. In this case, the samples were independent. We pulled a number of samples from process 1 and a number from process 2. There are times when the observations will not be independent. For example, suppose you want to compare two analytical test methods to see if there are any differences in the two methods. One might take a series of samples, divide each sample in half, and run each sample half in one of the two test methods. In this case, the samples are not independent. The methods learned previously for comparing the difference between two averages cannot be used. Instead, the procedure below for these paired sample comparisons must be used.
Methodology for Paired Sample Comparison
Consider the following example. Suppose there are two methods for determining nickel content. One method is a wet chemical method; the other method is atomic absorption. The same 10 samples were analyzed by each method. We will designate the number of samples as n. The samples were mixed and split in half. One half of the sample was tested using the chemical method. The other half was tested using the atomic absorption method. Thus, the same sample is being tested by each method. We will use the results to determine if there is a difference in the two methods. The results are given below.
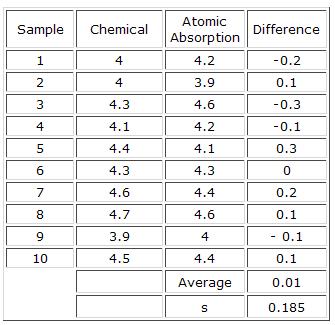
The first step in analyzing the results is to take the difference between the results for chemical (method 1) and atomic absorption (method 2) for each sample, retaining the sign:
D = X1 – X2
These differences have been calculated in the table above.
The next step is to find the average difference, D, and the standard deviation, s, of the D values. The average and standard deviation of the D values are given in the table above.
The next step is to calculate a confidence interval for the paired sample comparison. This confidence interval will give us a range of possible D values based on the sample results. If this range contains zero, we will assume that there is no difference between the methods. If the range does not contain zero, we will assume that there is a difference between the methods.
The 100(1 – α)% confidence interval for the paired sample comparison is given by
D +/- ts/SQRT(n)
where t is the value for the t distribution corresponding to n – 1 degrees of freedom. The value of t can be found in the t tables of many statistics books. It is also available in Microsoft Excel using the TINV function.
The number of degrees of freedom in this example is n -1 = 9.For α = 0.05, the value of t is 2.262.
The various values can now be substituted into the confidence interval equation:
D +/- ts/SQRT(n)
α0.01 +/- (2.262)(0.185)/SQRT(10)
0.01 +/- 0.132
-0.122 < D < 0.142
Since the interval contains zero, we conclude that there is no evidence that the two methods are different.
This methodology provides a simple way of comparing two different methods when the same sample can be used in the two methods.
Profound Knowledge
 For the next four months, starting next month, you will be receiving newsletter about “profound knowledge.” This will be four part series on Dr. W. Edwards Deming and his four bodies of profound knowledge. The picture shown here is of Dr. W. Edwards in 1957 (permission to use the Media Gallery photo of Dr. Deming granted by Diana Deming Cahill of the W. Edwards Deming Institute).
Our newsletters typically cover a topic on statistical process control (SPC). Implementation of SPC has been successful in many companies. Yet, there are probably many more unsuccessful implementation efforts. Why has this occurred? I believe the major reason is that the leadership of these companies did not understand that quality is more than SPC and attempting to put control charts on the floor. It represents a philosophy. And the philosophy that should have driven these leaders was that developed by Dr. W. Edwards Deming.
Dr. Deming spent years developing a theory for helping companies move forward into the twenty-first century. Remarkably, it all still applies today. Understanding Dr. Deming begins with understanding his “system of profound knowledge.” This system is composed of four bodies of knowledge:
- Knowledge of a system
- Knowledge of variation
- Theory of knowledge
- Knowledge of psychology
We will be looking at one of these each month for the next four months.
Summary
This newsletter showed how to perform a paired sample comparison. This type of test is done when you want to compare the results of two different processes (like test methods) on a sample The sample is divided in half and tested in each process. A confidence interval is developed based on the differences. If the interval contains zero, there is no difference between the two methods. If the interval does not contain zero, there is a difference in the two methods.