November 2012
 One of the purposes of control charts is to estimate the average and standard deviation of a process.The average is easy to calculate and understand – it is just the average of all the results.The standard deviation is a little more difficult to understand – and to complicate things, there are multiple ways that it can be determined – each giving a different answer.
Sometimes people ask why some software packages give different values for the control limits. Which program is correct? The answer is probably both. The difference is simply how the standard deviation is estimated. The objective of this newsletter is to show three different, but common, ways that the standard deviation may be estimated. We will look at data that are formed into subgroups and the control limits on the X chart.
In this issue:
- Data Subgroups
- Three Ways to Estimate the Standard Deviation
- Average of Subgroup Ranges
- Average of Subgroup Standard Deviations
- Pooled Standard Deviation
- Summary
- Quick Links
As always, you can leave comments at the end of the newsletter.
Data Subgroups
The data we will use are shown in the table.We have 10 subgroups, each containing 3 observations or results.
Table 1: Subgroup Data
|
Subgroup |
X1 |
X2 |
X3 |
Subgroup
Average |
Subgroup R |
Subgroup s |
|
1 |
80.3 |
86.9 |
108.0 |
91.73 |
27.7 |
14.47 |
|
2 |
99.4 |
89.5 |
96.4 |
95.10 |
9.9 |
5.08 |
|
3 |
95.1 |
95.9 |
85.3 |
92.10 |
10.6 |
5.90 |
|
4 |
99.0 |
123.9 |
100.6 |
107.83 |
24.9 |
13.94 |
|
5 |
97.1 |
98.6 |
107.7 |
101.13 |
10.6 |
5.74 |
|
6 |
97.4 |
105.5 |
104.5 |
102.47 |
8.1 |
4.42 |
|
7 |
97.9 |
106.0 |
95.6 |
99.83 |
10.4 |
5.46 |
|
8 |
81.6 |
99.9 |
101.1 |
94.20 |
19.5 |
10.93 |
|
9 |
90.8 |
90.1 |
95.1 |
92.00 |
5.0 |
2.71 |
|
10 |
107.3 |
102.7 |
92.5 |
100.83 |
14.8 |
7.57 |
|
|
|
|
Sum |
977.23 |
141.50 |
76.21 |
|
|
|
|
Average |
97.72 |
14.15 |
7.62 |
So, our subgroup size is constant for each of the 10 subgroups. The subgroup average, range and standard deviation have also been calculated for use below. The overall sum and average are given for subgroup averages, subgroup ranges and subgroup standard deviations – again for use below. There may be some minor differences due to rounding.
Three Ways to Estimate the Standard Deviation
We will look at three different ways to estimate the standard deviation. These impact how control limits are calculated. Control limits for the X chart are given by:
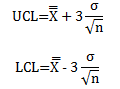
where UCL and LCL are the upper and lower control limits, n is the subgroup size, and σ is the estimated standard deviation of the individual values. Remember: the standard deviation of the subgroup averages is equal to the standard deviation of the individual values divided by square root of the subgroup size. These control limit equations may be different from the ones you normally use. They are not, as will be shown below.
The value of σ depends on the method you use to estimate it.We will look at three methods for estimating σ for subgroup data:
- Average of the subgroup ranges
- Average of the subgroup standard deviations
- Pooled standard deviation
Average of Subgroup Ranges
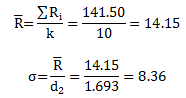
The average of the subgroup ranges is the classical way to estimate the standard deviation. The average range is simply the average of the subgroup averages when the subgroup size is constant:
![]()
where Ri is the range of the ith subgroup and k is the number of subgroups. The standard deviation is then estimated from the following equation:
![]()
where d2 is a constant that depends on subgroup size. Table 2 shows the values of d2 based on subgroup sizes up to 20. From the table, you can see that d2 for a subgroup size of 3 is 1.693.
Table 2: Constants for Control Charts
|
n |
d2 |
c4 |
|
2 |
1.128 |
0.7979 |
|
3 |
1.693 |
0.8862 |
|
4 |
2.059 |
0.9213 |
|
5 |
2.326 |
0.9400 |
|
6 |
2.534 |
0.9515 |
|
7 |
2.704 |
0.9594 |
|
8 |
2.847 |
0.9650 |
|
9 |
2.970 |
0.9693 |
|
10 |
3.078 |
0.9727 |
|
11 |
3.173 |
0.9754 |
|
12 |
3.258 |
0.9776 |
|
13 |
3.336 |
0.9794 |
|
14 |
3.407 |
0.9810 |
|
15 |
3.472 |
0.9823 |
|
16 |
3.532 |
0.9835 |
|
17 |
3.588 |
0.9845 |
|
18 |
3.640 |
0.9854 |
|
19 |
3.689 |
0.9862 |
|
20 |
3.735 |
0.9869 |
For the data in Table 1, the average range and σ are given by:
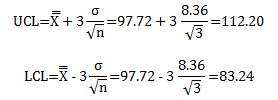
Using the estimate of the standard deviation from the average range, we can now calculate the control limits:
You may not be used to calculating control limits this way for the X chart. You probably use the following equations:
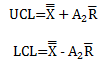
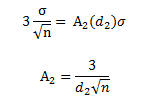
where A2 is a constant that depends on subgroup size. Consider just the UCL. There are two different equations for the UCL above, which must give the same result. So,
![]()
This can be rearranged to the following:
![]()
Substituting for R and solving for A2 gives:
Substituting in d2 and n for our example gives:
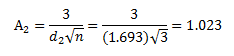
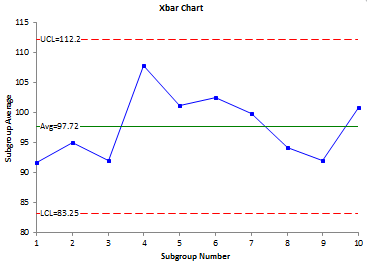
This is the value of A2 for a subgroup size of 3 that you find in the tabulated control chart constants for A2. For a table of these values, please see our newsletter our X-R control charts. So, both methods for calculating the control limits are equivalent. The X control chart for these data is shown in Figure 1.
Figure 1: X Based on Sigma from Average Range
Average of Subgroup Standard Deviations
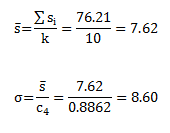
The average of the subgroup standard deviations could also be used to estimate the standard deviation. When the subgroup size is constant, the average of the subgroup standard deviations is given by:
![]()
where si is the standard deviation of the ith subgroup and k is the number of subgroups. The standard deviation is then estimated from the following equation:
![]()
where c4 is constant that depends on subgroup size. The values of c4 are shown in Table 2 above. For n = 3, the value of c4 is 0.8862. For the data in Table 1, the average standard deviation and ? are given by:
This value of σ is different than that estimated by the average range, which was 8.36.Thus, the control limits will be different also.The control limits based on the standard deviation estimated from the subgroup standard deviations are:
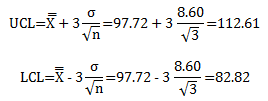
The differences are not large, but there are differences.This is why people wonder why the control limits can be slightly different.It is usually the way the standard deviation is estimated.The control chart with these limits will look about the same as in Figure 1 – just with the control limits a little wider in this example.
Pooled Standard Deviation
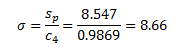
The pooled standard deviation, sp, can also be used to estimate the standard deviation.The standard deviation, σ, is equal to the pooled standard deviation divided by c4:
![]()
where:
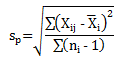
where Xij is the jth observation in the ith subgroup, Xi is the average of the observations in the ith subgroup, ni is the number of observations in the ith subgroup, c4 is the constant defined above but this time it depends on the degrees of freedom (df); which is given by the sum of the ni -1 values (the denominator under the square root sign. Thus,
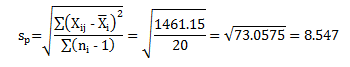
For df = 20, the value of c4 is 0.9869. The estimated standard deviation is then given by:
This third method of estimating the standard deviation gives another value for σ.The control limits will be different as well:
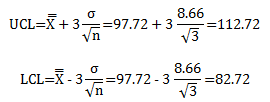
The control chart will look the same as Figure 1 – again with slightly different control limits.
Summary
This newsletter has looked at the three different methods of estimating the standard deviation from data that are in subgroups. Each method gives a different value for the estimate standard deviation:
- σ from the average range = 8.36
- σ from the average standard deviation = 8.60
- σ from the pooled standard deviation = 8.66
This leads to different values for the control limits. Which method is correct? All three are correct. Dr. Donald Wheeler has suggested that the average range method is more robust than the pooled standard deviation. But in the end, the important thing is the story that the control chart is telling you about your process. Minor changes in the estimate of the standard deviation will not change this in most cases.
Good morning, Bill -The newsletters are great but it would be nice to be able to print them and HTMLs do not print well. Any chance that you could either publish in PDF format or add a "printer friendly" option?Thanks.dave
Hi Dave,I will take a look at doing the PDF format. You can always copy the newsletter and paste into Word in the meantime. Thanks for the comment on the newsletters. Bill
Very informative article , had observed the difference in control its but known the reason yet..thanks for sharing the underlying reason..
How do you calculate the 1461.15?? From the initial data, how should I interpret the Xij???
There should really be a second summation sign in the numerator. Below are the calculations. Xij is the ith observation in the jth subgroup.
How to calculate C4?? Is there a ful table available??
There is a table in the article. What are you looking for?
Dear Dr. Bill McNeeseI have a question about Control Limit UCL & LCL, Sigma = Rbar/d2 ,and Theory is Control Limit is 3Sigma (+/-) so, Can we just use UCL=Xbar+3*Rbar/d2 and LCL=Xbar-3*Rbar/d2 ( 3*Rbar/d2 = 3Sigma), Hope you can help me to have more clear about it ,I known that correct Formula shows ,Formula ,UCL = Xbar + 3 Sigma/SQRT(n) ,LCL = Xbar-3Sigma/SQRT(n) ,But it will not be 3Sigma because still devide to SQRT(n), Why is it? ,Thank you so much
Please see this link for information on where control limits come from:
https://www.spcforexcel.com/knowledge/control-chart-basics/control-limits
Control limits are +/- three standard deviations of what is being plotted. So, with subgroup averages, it is +/- three standard devations of the subgroup averages. The subgroup averages standard devaition comes from sigma/sqrt(n) where n is the subgroup size and sigma is the standard devaition of the individual values (estimated by Rbar/d2).
Understood now, thanks so much Dr Bill
Dear Sir, Greetings, I have a doubt, is it calculate the control limits for population method.I have 125 nos samples. i will not seperate this for sub groups. How to calculate the UCL & LCL. Is it possible.
Use an individuals control chart if you are not going to subgroup.
https://www.spcforexcel.com/knowledge/variable-control-charts/individuals-control-charts
Hi there, i was wondering if u could help me in the following problemI have been given 50 numbers in an excel sheet.. each number represents an average of 5 subsample observations. I have not been given the individual 5 numbers, just their average. and therefore am unable to calculate the range.Ive also been told the 50 average of subsamples follow a normal distribution following N(2,3), sample size n = 5 , the standard deviation = 3, and to follow a 2-sigma deviation.The average of the 50 averages i calculated =1.94How would i go about calculating the LCL and UCL, given the information i have.? many thanks in advance mate
All the information you need in the article. You have the average. Are you saying the distribution of subgroup averages has a standard deviaiton of 3? Or is the individual values? What do you mean by a 2 sigma deviation?
In X-R chart the value of A2R is 1.8 calculate the value of sigma i.e standard deviation?
Not clear to me what you are asking.
Why don't we estimate standrad deviation by using standard deviation of all samples?
If you use the calculated standard deviation of all the range, it will inflated when the data are not in control. The purpose of a control chart is to determine if the data are homogeneous. Calculating the standard deviation assumes that the data are homogenous.
For PpK calculation, overall standard deviation is used. Can you please explain how to calculate for above datas.
The calculated standard deviation is the same as the STDEV function in excel. It is the square root of the sum of the (Xi-Xavg)^2 divided by n – 1.
Request you all to explain how we get 20 for summation of n-1That is degrees of freedom is 20
There are 10 subgroups. The subgroup size is 3 for each subgroup (ni = 3). Those three values are used to calculate a subgroup average. So, if you have the subgroup average and two values, the third value is set in the subgroup. So the degrees of freedom for each subgroup is two. There are ten subgroups, so 10X2 = 20.
is sigma the same thing as standard deviation? so if the CL is 2, UCL is 5, and LCL is -1, is the standard deviation 1 or 3?
Sigma is the estimated standard deviation from a range chart. If the average is 2 and control limits -1 and 5 then the estimated sigma value is (UCL – Avg)3sigma or sigma = 1
what is the relationship between standard deviation and upper & lower limit?
The upper and lower control limits are three sigma away from the average. Where sigma is given as shown above.
For Individuals data (i.e. subgroup size = 1), UCL= Mean (˭X) + 3σ; LCL = Mean (˭X) – 3σ. For the below data, Mean is 5.9848 and Standard deviation is 0.1959. But UCL and LCL calculated by Minitab is 6.39 and 5.579 respectively. Why they are different from the calculations using the above equation?6.05, 5.99, 6.11, 6.13, 5.87, 6.05, 6.23, 6.49, 6.15, 5.89, 5.87, 5.99, 6.07, 6.17, 5.86, 6.07, 6.01, 5.87, 5.66, 5.58, 5.62, 5.89, 6.02, 5.93, 6.05
Control limits are not based on +/- 3 standard deviations where the standard deviation is the calculated standrade deviation (like STDEV in excel). The limits are base on +/- 3 sigma where sigma is estimated from the range chart. For individual values, sigma = average moving range/1.128.