You are monitoring a critical product characteristic using a control chart. You have been through several days of training on Statistical Process Control (SPC) on how to use control charts – how they are put together and how to interpret them. You know all about control charts.
All has been going smoothly. The points on the chart are randomly distributed around the average. You have been sitting back, relaxing, and enjoying just watching the process run. There is only common cause of variation present – the normal variation in the process. The process is operating as it was designed to operate. All is well in the world.
 Suddenly, the control chart shows a spike – a point beyond the upper control limit. You remember your training. When there is an out of control point, it means that there is a special cause of variation present. All you have to do is to find the reason for the special cause and eliminate it from occurring again! As Dr. Deming would say: so simple.
At least it sounded simple in the training. Now you are faced with this real special cause of variation. And the realization hits you – there many reasons this out of control point could have occurred! Maybe in the hundreds. Maybe in the thousands. Where do you start looking? How many do I have time to check? What do I do next? Your world has turned upside-down – from going along in control and now suddenly faced with an out of control point and not knowing where to start looking for the cause.
One of the hurdles to effectively using SPC is the problem with how to handle the out of control points – those special causes of variation. This month’s newsletter provides an answer to this problem – a control strategy. A control strategy is a list of the top 5 to 10 reasons a process/product characteristic would go out of control. The control strategy is developed with a lot of input from those closest to the process. It includes the possible reasons, what is to be investigated, the results of the investigation and a sign-off. This is a simple, yet effective, tool for helping those closest to the process find the reasons for the special causes of variation. But, to be successful, you need a support system that encourages the use of SPC and control strategies.
A simple control strategy template is available for download. Please feel free to leave a comment at the end of the newsletter. In this issue:
- Control Charts and Control Strategies
- A Simple Control Strategy
- Using Control Strategies Successfully
- Other Forms of Control Strategies
- Summary
- Quick Links
Control Charts and Control Strategies
 Control charts tell us two basic things: when to take action and when to leave our process alone. If you are new to control charts or would like a review, please see our March 2011 newsletter on the purpose of control charts. We should take action when our process shows signs of special causes of variation. When our control charts show us that there is an out-of-control situation, it is the responsibility of those people closest to the process to find the cause for the out-of-control situation and eliminate the cause from the process (sometime with the help of leadership).
This prevents the cause from occurring again. Sounds fairly easy, doesn’t it? However, bringing a process back into control is usually not that simple. For example, if you think about all the possible reasons why a process may go out of control, you will probably develop a fairly long list. Time constraints and costs probably wouldn’t allow you to look into all the possible causes. In most cases, you do know that some causes are more likely to occur than others. Control strategies help you look into the more likely causes.
So, a control strategy is a specific action plan for bringing a process back into control. The strategy usually consists of five to ten steps that help you find the reason for special cause, and most importantly, help you do something about the cause.
A Simple Control Strategy
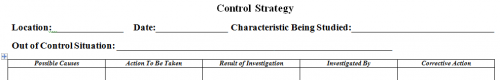
A control strategy should be filled out for each out of control points. One simple format is shown in Figure 1. Only a portion of the control strategy is given but you can download the Word document containing the control strategy here. The top part of the control strategy is simply the basic information of location, date and the characteristic being studied. The out of control situation is also listed (point beyond the control limits, a run of seven or more above or below the average, etc.).
Figure 1: Basic Control Strategy
There are then five columns that are to be filled out by the person closest to the process. These are described below. As an example, assume that the process is a batch reaction in chemical plant and the process characteristic is product purity. The complete control strategy for this example can be downloaded here.
Possible Causes
This is a list of possible causes for the out of control points. These should be developed with input from those closest to the process. When developing this list, you are answering the following question: what could cause this out of control situation to occur? You might have a different set of reasons for a point beyond the control limits than for a run above or below the average (or any other test for statistical control you use.)
The best way to develop the list of possible causes is through brainstorming – putting up as many ideas as possible with no discussion. After brainstorming, take the list down to the top 5 to 10 most likely causes.
Below are some possible causes for the product purity being above the upper control limit:
- Too much catalyst added
- Too little catalyst added
- Purity of catalyst too low
- New batch of catalyst
- Incorrect temperature or pressure
- Lab error
Action to be Taken
For each cause listed, determine what action the person closest to the process should take to help determine if it is indeed the reason for the out of control point.
For the product purity example, possible actions to take include:
- Too much catalyst added – Check batch records; check scales
- New batch of catalyst – Check purity records
- Lab error – Ask laboratory about test
Result of Investigation
For each cause listed and action taken, record the result of the investigation. What did the person who took the action find out?
For example, for the “too much catalyst added” cause, the result of the investigation could be filling out the following:
Amount of catalyst added ____ lbs.
Amount correct: ____ Yes ___No
Scales accurate: ____ Yes ___No
For the lab error, the result of the investigation could be filling out the following:
Test method in control:____ Yes ___No
Note that re-testing is not in the control strategy. The laboratory should be monitoring all its critical test methods using control charts. As long as those tests are in statistical control, there is no need to retest the sample – unless of course you are just hoping that the random variation in the test method will bring your result back into statistical control. Not the right approach though!
Investigate by
The person who performs the investigation enters his/her name here.
Corrective Action
The person closest to the process records the corrective action if one of the causes is found to exist. This column simply says what was done to correct the situation.
Using Control Strategies Successfully
 You can put these control strategies into place, but unless you have a support system that encourages their use and reviews the results, your efforts will fail. Those closest to the process must know that this process is important to leadership, and that their efforts will be reviewed and recognized.
There are a number of ways to do this depending on how your organization is set up. There should be a group that reviews all statistical control charts including the control strategies – weekly if possible. They can be a group of SPC facilitators, engineers, black belts, etc. The group must be trained in statistical techniques as well as in people skills. It is people who get things done – not statistics. To only train in statistics is a mistake. The group needs to understand things such as how to influence people, how to provide feedback and corrective coaching, and how to give recognition and reinforcement.
One purpose of this review is to ensure that the control strategies are being used effectively and to look for trends. Are the same issues continually arising? Are there some potential causes listed that never occur? Do some control strategies need to be changed? The results of these reviews are presented to leadership each month.
You should have a control strategy for each control chart. If it isn’t important enough to develop one, then you probably should re-think whether you need the control chart. The control strategy gives you a record of what was done for each out of control point on a control chart.
Will you find the cause for each out of control point? No, you will not. The last item on the control strategy should be what to do if you didn’t find the reason for the out of control point. It can be as simple as informing supervision. What do you do if the next result is also out of control? Adjust the process? There are many things this group must decide.
Other Forms of Control Strategies
The above template is just that – one of many possible templates you can use for control strategies. For example, the control strategy below is one that is used for monitoring a Rockwell hardness test machine. The standard is tested at the start of each shift and plotted using a control chart. If the control chart shows that a special cause of variation is present, the form in Figure 2 is brought up on the computer to be filled out.
Figure 2: Hardness Tester Control Strategy
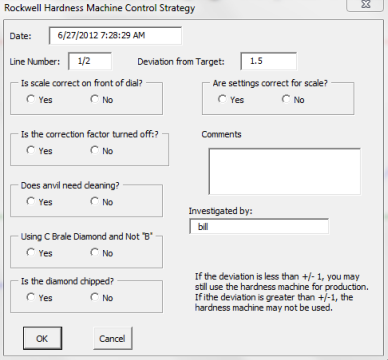
The format for the control strategy is not that important. What is important is that the control strategy provides a list of potential causes to check when a process goes out of control as well as a sign off by the person responsible. The hardness strategy above does not include specific action to take. For example, it does not say what to do if the diamond is chipped. But the operators are trained to put down what they did in the comment section. Your control strategies will have to fit your processes.
Summary
This newsletter has introduced control strategies. Control strategies should be developed with input from those closest to the process. They know best what the most likely causes of an out-of-control situation are, and what to do about them.
Control strategies should be updated regularly. If one of the causes on the control strategy has never surfaced as a reason for an out-of-control point, then that cause should be deleted from the strategy and replaced by another possible cause.
There are various benefits to control strategies. Control strategies provide a method of systematically looking for special causes. This helps those closest to the process to do their jobs better. Also, control strategies help us increase the understanding of our processes. For example, if you use and update control strategies over time, you will establish a database that will evaluate the causes of out-of-control points long term. This increased knowledge about your processes will be useful for training new people. They will have a standardized approach for controlling their processes instead of working by trial and error. Control strategies also provide a permanent record of what happened after each out-of-control situation.
Great read. You are really helping alot through this.
Isn't there something missing in this statement:"You can put these control strategies into place, but useless you have a support system that encourages their use and reviews the results, your efforts will fail."
Yes, I had "useless" instead of "unless". It is fixed now in the article. Thanks for the comment.
In this highly automated world, process control strategies and tactics are critical if the "chartists" are to survive.
High speed manufacturing requires fast response to signals that seem to say that the process tools are "out of control" or more nuanced by multivariate data, "are not the same machine any more."
And the responses can be richer and more valuable, more likely to avoid over-control and get the right response type, if the early product pilot rampup was accompanied by great DOE, MSA, and early SPC efforts that resulted in what we used to call FMEA's and Control Plans, and Capability Assessments, and Robust Marathon testing of the equipment. Losing those opportunities, or failing to put the learning in a useful format for longer term actions (usually by people not present during the pilot phase) is key.
So any templates or automated GUI's that can capture the "known critical parameters" and their "possible failure modes" are great ideas. The trick is to keep up adding new information to those tools, so the simpler they are to CHANGE the more likely they will keep learning!
What if a data is out-of-control but the value is still within specifications? What do you think will be the disposition for the hold lot, is it still passed or reject?
Since the process is out of control, you should try to find the special cause and remove it. However, the product is stil within specifications – so I do not see a reason to put it on hold. It does meet your cusotmer specifications. I would have thought by now customers would require statistical control, but they do not. So, I would pass the lot as long as it is within specifications.