August 2007
In this issue:
Has your warehouse ever delivered the wrong item to a customer? Or the wrong quantity? Or sent it out late? What was the impact on the customer? This month’s newsletter examines how statistical process control (SPC) can help drive continuous process improvement in a warehouse setting. Many organizations fill customer orders from a warehouse. What happens when your warehouse processes fail and a customer receives an incomplete order? The wrong material? The wrong quantity? Or the order arrives at the wrong destination?
At a minimum, it means rework for your company to correct the problem. It could mean lost sales. It could mean a customer who will never come back and who will tell many others about the poor service delivered by your company. Warehouse performance is very important. This newsletter examines how you can use SPC to help drive continuous process improvement. While this newsletter is geared toward warehouse processes, the same approach can be used for any process.
The Warehouse
For this newsletter, assume that our warehouse has four major processes:
- Receiving
- Picking
- Packing
- Shipping
We want to improve all these processes. In our warehouse, material arrives from a supplier. It is important that the material is received correctly. Receiving the wrong material will cause problems down the road. The material is checked in by the receiving personnel. If it is for stock inventory, receiving puts the material in its appropriate location in the warehouse. If it is for a customer order, receiving stages it for picking. Putting the material in the wrong location will cause problems for the picker.
A pick ticket prints and the picker picks the items on the ticket. The picker takes the items to a packer who checks the order. If there are any mistakes, the packer lets the picker know. The picker then corrects the mistake. The picker can pick the wrong material or the wrong quantity. Once the order is correct, the packer packs the order and sends it to shipping. The material must be packaged to the customer requirements. Shipping prepares the package for shipping. Shipping can be by UPS, FedEx, common carrier, etc. It is critical that the package be shipped to the correct address.
Process Management
Each of the four processes above can be continuously improved by using the five process management model: define, document, measure, manage and improve. This model is described in more detail in our November 2006 newsletter, which is available on the website. A brief overview is given below.

The first step is to identify/define the purpose of the process – why it exists. This is the process mission. This step also involves identifying the customers and suppliers of the process and their needs and expectations.
The second step of the method is to document the process. This means developing a process flow diagram as well as the standard operating procedures and job work instructions if required. At this point, if there are obvious changes that can be made to improve the process, the changes are implemented.
The third step is to measure the process. Measurements should be taken over time so improvements can be seen.
Managing is the fourth step. This involves setting standards for the process, bringing the process into control, determining the process capability and using problem- solving techniques to improve the process if it is not capable of meeting the standard.
The last step is to improve the process. The objective of this step is to define what world-class is for the process and take steps to move towards the world-class process and perfection.
We will demonstrate the application of this model using the picking process above. Of course, the best team to work on this process would include the pickers themselves along with a facilitator to work them through the methodology. The results below are based on an actual team that worked on improving the picking process.
Picking Process
The first step is to identify the purpose of the picking process. Why do we have a picking process? The team developed the following:
The purpose of the picking process is to accurately pick the line items listed on a pick ticket in a timely fashion.
The team also identified the customers and suppliers of the picking process. While the external (final) customer is important, the immediate customer is the next person in line: the packer. The packer needs the items to be picked correctly and quickly enough so the packer does not run out of material to pack. The receiving department is one of the suppliers to the picking process. Receiving puts away the material to be picked. Sales is another supplier to the picking process. Sales provides the information on the pick ticket.
The next step is to document the picking process. This step involves, at a minimum, developing a process flow diagram of the picking process. You may also want to develop written procedures. A process flow diagram simply lays out the steps in a process. An example of a picking process flow diagram is given below. This is really a simplification of the actual process.
The next step is to develop metrics that reflect how the picking process is operating. The process flow diagram helps point out where measurements can be made. This is one advantage of doing a process flow diagram. It is also helpful to think about measuring a process in four dimensions: quality, quantity, timeliness and cost. The team decided to develop the following measures:
- Picking accuracy: the % of line items picked correctly per picker and overall per day
- Average number of line items picked per hour per picker and overall
- Overtime costs for pickers per week
- Number of problems found at the time of picking
The picking accuracy chart can be displayed as a p control chart (July 2005 newsletter on the website). The other metrics can be displayed using an individuals control chart (October 2006 newsletter on the website). In addition, a Pareto diagram (June 2004 newsletter on the website) should be used with picking accuracy and problems found at the time of picking to describe what the errors were.
For example, below is the picking accuracy data for one picker during one month. The daily data are collected by the packer. He records the number of line items per order and the number correct. He also records the time of day the errors were made.
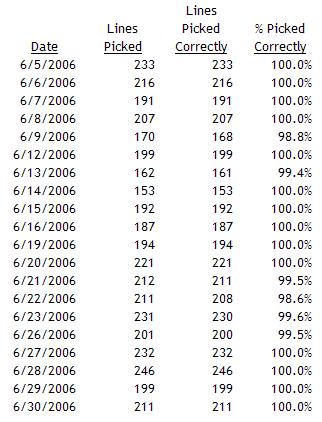
This data can be used to make the following p control chart:
This picker’s process is in statistical control. He is averaging 99.78% picking accuracy. You can predict what he will do in the future. To improve, the process must be fundamentally changed. During the month, the picker made 9 picking errors. The Pareto diagram below shows the picking errors that the picker made. This Pareto diagram begins to give insights on how to improve the process.
The next step is to manage the process. During this step, a goal is set. In this case, a goal for the entire picking team was set at 99.90% average picking accuracy. The average for all the pickers at this time was 99.75%. The team worked on determining reasons for picking errors. They used different root cause analysis techniques including the “5 Whys” and the cause and effect diagram. They found a number of things caused errors. One was that similar part numbers were in bins next to each other. This made it possible for a picker to select the wrong item. Items with similar part numbers were separated.
The pickers also found that most errors occurred late in the day. This was because sales usually entered a lot of orders toward the end of the day. The pickers were rushing to get the orders picked to keep overtime at a minimum. Likewise, the packers were rushing to get the orders packed. The warehouse worked with sales to release orders earlier. In addition, the warehouse went to a staggered shift operation.
These improvements, with others, increased the picking accuracy from 99.7% to 99.92%. The team was successful in its efforts.
The last step is to improve the process. In this step, the team looks at continual improvement in the picking accuracy and at what could be done to make the process world-class. This step never ends in the continual improvement process. The goal is the continual elimination of causes of defects.
Other Metrics
Setting up the measurements is key to improving the processes. Potential measurements for the other processes in the warehouse are given below.
- Receiving
- Number of lines received per day (X-mR)
- Number of problems found per day (X-mR, Pareto by reason code, supplier)
- Overtime cost due to receiving per week (X-mR)
- Packing
- Number of lines packed per day (X-mR)
- Number of lines packed per hour (X-mR)
- Overtime costs due to packers per week (X-mR)
- Shipping
- Number of lines shipped per day(X-mR)
- Overtime costs due to shippers per week (X-mR)
Some of these metrics are not under the control of the employees. For example, the receiver does not control the number of lines coming in each day. But this metric is important to monitor changes in workload.
The keys to improving any process are to follow the five-step process management model (identify, document, measure, manage and improve) and to include those closest to the process in working on continuous improvement.
Summary
This month’s publication examined how you can use SPC to enhance your process improvement efforts in a warehouse setting. Four processes were included: receiving, picking, packing and shipping. The five-step process management was used: identify, document, measure, manage and improve. Picking was examined in details. Metrics for the other three processes were suggested.