November 2006
In this issue:
- Variation: Special and Common Causes
- Control Charts and Variation
- The Red Beads
- Overcontrolling
- Getting Started
- Quick Links
This is the second in a special four-part series on the teachings of Dr. W. Edwards Deming. Dr. Deming was remarkable man. He is often credited with helping the Japanese rebuild economically after World War II. The Deming Prize is still given to companies for major advances in quality improvement.
Dr. Deming spent years developing a theory for helping companies move forward into the twenty-first century. Remarkably, it still applies today. Understanding Dr. Deming begins with understanding his “system of profound knowledge.” This system is composed of four bodies of knowledge:
- Knowledge of a system
- Knowledge of variation
- Theory of knowledge
- Knowledge of psychology
To understand the system of profound knowledge, you must understand what a system is and what the “aim” of a system is. You must also understand variation and realize that the true benefit of this understanding comes in how you lead people. You must understand the theory of knowledge, and finally you must understand motivation and psychology. Thank goodness you don’t have to be an expert in each of these areas. However, you must know something about each area because they are interrelated.
Part 1 of this series covered the first part of profound knowledge, knowledge of a system, and is available on our website. This second part covers the profound knowledge of variation. Several of our past e-zines have focused on variation and will be referred to below. You can also learn more about Dr. Deming by visiting www.deming.org.
Variation: Special and Common Causes
 The second part of profound knowledge is variation. A major barrier to the use of control charts is the failure of people to understand the information contained in variation. If you understand this information, you will realize that the type of action required to reduce special cause variation is totally different from the type of action required to reduce common cause variation. You will also understand why costs decrease as quality improves and why management that blames all its problems on the employees is totally wrong. (Note: permission to use the Media Gallery photo of Dr. Deming granted by Diana Deming Cahill of the W. Edwards Deming Institute.)
Variation is inevitable. Everything varies. A key part of continuous improvement is understanding the information contained in variation. Many organizations look at variation as only being within or out of specifications. We need to change our paradigm of variation. Is the variation we see due to special causes of variation or to common causes of variation, i.e., the way management designed the process?
Common cause variation is the variation that exists because of the way the process was designed (by management) and is managed. It refers to the many sources of variation that are normally present within a process. For example, consider how long it takes you to drive to work (assuming your process for doing so is the same from day to day). Suppose, on average, it takes 20 minutes to get to work. It doesn’t take, however, 20 minutes each day. Suppose you know that, in general, it will take between 15 minutes and 25 minutes to get to work. Some days it may take 22 minutes; other days 18 minutes; others 24 minutes, etc. The difference between each day’s time and the average, most of the time, will not be alarming to you. You realize that the differences are due to the traffic, speed you drive, etc. All these causes are called common cause variation. They represent the normal variation in your process of getting to work.
In general, there are a large number of common causes present at any time. Each cause has an effect that can’t be measured. For example, suppose one day you get to work in 17 minutes. You can’t relate that to driving at a certain speed, to traffic patterns, to the way your car was running, etc. As long as you keep the process the same, common cause variation is the same from day to day. Thus, common cause variation is consistent over time. We can predict the effect of common cause variation.
Special causes of variation are not part of the way the process is managed and are considered abnormalities. This means that something that normally doesn’t occur has happened. Consider the driving to work example. If you get a flat tire on the way to work, you will not arrive at work in the normal span of 15 to 25 minutes. This is a special cause. Its effect on the process is measurable. For example, if you have a flat tire, it might take 60 minutes to get to work. This is definitely out of the normal range of 15 to 25 minutes and is directly attributable to having a flat tire. Other possible special causes for driving to work would include adverse weather conditions and traffic congestion due to an accident. Special causes are sporadic in nature and cannot be predicted. However, they are usually easily discovered.
The approach to variation in this case is to look at what variation is due to common causes and what variation is due to special causes. It is important to distinguish between the two because the responsibility for process improvement depends on what type of variation is present. In general, special causes are not part of the process and can be discovered. It is usually the responsibility of the front-line personnel to find and eliminate special causes. Special causes are often related to one machine, one person, one type of raw material, sudden change in environmental conditions, etc.
Common cause variation, on the other hand, is part of the system or process. To decrease common cause variation, you must change the system. This is management’s responsibility. Only management, not the front-line personnel, has the authority to change the system or process.
Dr. Deming has estimated that 94% of problems are due to common causes and are management’s responsibility. He estimates that only 6% of problems are due to special causes.
We have two previous e-zines that cover variation in detail (Jan 2004 and May 2006). These are available on the website.
Control Charts and Variation
 To determine how to improve a process, we must separate common causes from special causes of variation. There is only one way to effectively distinguish between common and special causes of variation, and that way is to use control charts. Control charts present a picture of a process over time and tell you when only common causes are present or when there are also special causes present. A control chart is constructed by plotting data over time and then calculating averages and control limits. As long as no points are beyond the control limits and there are no non-random patterns, the process is considered in statistical control (stable), i.e., only common causes of variation are present. The process is consistent and predictable. It is operating at the highest productivity and lowest cost for the current process.
Continuous improvement cannot come from mass inspection of the product. Instead, we must look at the process that produces the product and determine how to improve the process by knowing what type of variation is present. This is point 3 of Dr. Deming’s 14 points: Cease dependence on inspection to achieve quality. The first step in process improvement is to eliminate special causes of variation. The next step is to continually reduce the common causes of variation in the system. This is point 5 of Dr. Deming’s 14 points: Improve constantly and forever the system of production and service, to improve quality and productivity, and thus constantly decrease costs.
Variation is, in most organizations, handled only through the use of control charts on the factory floor. Knowledge of variation is not applied in the management of people. A distributor keeps a control chart in the warehouse on the number of line items picked incorrectly each day. It is in statistical control. The warehouse manager believes that pointing out the mistakes to the pickers will help decrease the errors. He doesn’t understand variation, even though he has been “trained”. Oh yes, he remembers the red beads in the bead bowl experiment – but this is real life, not red beads. Any worker can make fewer mistakes if he is just more careful.
The Red Beads
The red beads represent a method of demonstrating the futility of most management systems for improving quality. Dr. Deming often referred to it as a stupid experiment that you’ll never forget.
The experiment requires a sampling bowl that contains 80% white and 20% red beads, – hence the name “red bead experiment”. You also need a mechanical sampling device such as a paddle containing 50 dimples to hold the beads. You could also use different colored beads as long they make up 20% of the population. Management has developed and purchased this “white bead” process for the working force. There is a major customer that needs white beads and will not accept anything less than the 100% white beads (zero defects). All red beads are considered to be defective. These red beads represent all the things that can go wrong with a process including a mechanical breakdown, a defective part, a bad design, a poor procedure, an untrained worker, etc.
Each worker (there are several) holds the paddle with 50 holes (the day’s quota). The worker is allowed to dip the paddle one time (very specific operating instructions) into the bowl. Of course, the worker produces some red beads. Each worker dips the paddle in the bowl to represent one day’s work. After each day, the best worker is reinforced; the worst worker is threatened. In reality, the workers cannot control the number of red beads they produce. The red beads are part of the system. A control chart for a typical red bead experiment is shown in the figure above.
All the points are within the control limits. All variation is due to common causes. To decrease the number of red beads, the process must be changed. No amount of encouragement, threats, or exhortations will help the worker improve his production. This is point 10 of Dr. Deming’s 14 points: eliminate slogans, exhortations, and targets for the work force asking for zero defects and new levels of productivity.
The bead bowl experiment is an excellent example of ascribing defects to workers when in fact they are due to the system. Ranking of the workers by the number of defects they produced tells us nothing. This ranking merely represents the effect of the system on the people for that time period. However, for some reason, this lesson does not stay with management. Management still tends to believe that workers can produce more, salespeople can sell more. They just have to try harder.
Overcontrolling
 Of course, some processes are people intensive while others are not. Management must learn to understand variation and the effect that the system described above has on people in the system. The components of a system are often dependent on one another. What is the impact on people? Management is about making mistakes. According to Dr. Deming, there are two mistakes that you can make in management. Mistake number 1 is to assume that a variation is due to special causes when in fact it is due to common causes. Mistake number 2 is to assume that a variation is due to common causes when in fact it is due to special causes. While you can avoid making one mistake by maximizing the times you make the other mistake, a manager cannot avoid both mistakes. The objective is how to minimize your losses due to these mistakes. This is the purpose of control charts and understanding variation.
In any process, there is the danger of overcontrolling the process if one does not use his knowledge of variation. Dr. Deming has said “If anyone adjusts a stable process for a result that is undesirable, or for a result that is extra good, the output that follows will be worse than if he had left the process alone.” This is often called tampering with the process. It is something that is done often by front line personnel and very often by management. This increases variation in a process as well as increases losses. Doing your best is no longer sufficient. You must know what to do.
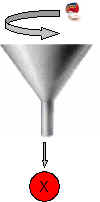
An excellent example of overcontrolling is the funnel experiment described by Dr. Deming. The objective of the funnel experiment is to drop a marble through a funnel and hit a target. A point on a level surface is designated as the target. A funnel is held a certain distance above the surface. A marble is dropped through the funnel. The spot the marble comes to rest on the surface is marked. This is repeated for at least 50 drops for each of four different rules:
- Rule 1: Leave the funnel fixed over the target.
- Rule 2: For every drop, the marble will come to rest a distance “z” from the target. Rule 2 is to move the funnel a distance -z from its last position.
- Rule 3 moves the funnel a distance from the target.
- Rule 4: Rule 4 is simply to set the funnel over where the last drop came to rest.
The results of these rules are described in detail in our July 2006 e-zine: Overcontrolling a Process. Rule 1 provides the least variation and is stable. Rule 2 is also stable, but increases the variation in the process by over 40%. Adjusting the process for the last result when the process is in control increases the variation in the process. And management often does this. Rules 3 and 4 are more unstable processes.
Dr. Deming lists examples of Rules 2 – 4. Examples of Rule 2 include:
- Feedback mechanisms that respond to a single data point.
- Adjusting a process when a part is out of specifications.
- Operator adjustments without the aid of control charts.
- Changing company policy based on the latest attitude survey.
- Recalibrating instruments to a standard.
- Adjusting the quota to reflect current output.
- Using variances to set budgets.
- Stock market reaction to last month’s deficit.
Examples of Rule 3 include:
- Illicit drugs. Enforcement improves so drugs become scarcer. The price goes up which stimulates the import of more drugs. The cycle repeats.
- Gambler increases his bet to cover losses.
Examples of Rule 4 include:
- History passed down from generation to generation.
- Worker training replacements in succession.
- Adjustment of time of meeting based on last actual starting time.
- Use of last board cut as a pattern for the next board.
- Sitting in a circle with a number of people. One person whispers a secret to the next person who in turn whispers it to the next person and so on.
To avoid overcontrolling a process, you must understand variation.
Getting Started
 Management must teach everyone in the organization about variation. An operator in a plant was responsible for the drying of a resin. Samples were taken at certain time intervals and measured for water content. The objective was to keep the water content at 0.2%. If the resin had a water content greater than this, the operator raised the temperature of the dryer. If the resin had a water content less than this, the operator lowered the temperature. The operator was trying to do his best, yet he was actually increasing the variation in the process by overcontrolling the process. This was management’s fault. They hadn’t taught him the concept of variation. Another question to be answered: Is the measurement system for measuring water content in statistical control and how much variation does it contribute to the overall variation?
Management training should be an important issue for every organization. Many companies train their management personnel on many issues regarding the handling of people. These include how to coach people, how to reinforce people, and how to lead people. When it comes to dealing with performance improvement, how many training seminars teach the concept of variation in terms of how to improve performance? Is performance really a problem or is it part of the natural variation in the system?
Next month, we will be looking at the third component of profound knowledge: the theory of knowledge.