November 2004
In this issue:
As we stated last month, customers expect a consistent quality product that meets their specifications as it is produced – not by sorting or rework. We have seen how control charts can tell us if our product’s quality is consistent, but control charts do not tell us if the product is meeting customer specifications. To determine that, we must return to histograms.
Histograms graphically display the variation in a process. Once our process is in control, we know that if we take samples and construct a histogram from yesterday’s, today’s, or tomorrow’s product, the histogram will look basically the same in terms of shape, average, and standard deviation.
For processes that are in statistical control and that are normally distributed, we can do a Process Capability Analysis. Last month’s newsletter contained an explanation of process capability and introduced one metric (Cp) to measure process capability. This month, we introduce a second metric to measure process capability – Cpk.
Cpk
Cp values are not the best indicators of process capability. As shown last month, Cp is the ratio of the engineering tolerance (USL – LSL) to the natural tolerance (6s). The value of Cp does not take into account where the process is centered. Just knowing that a process is capable (Cp > 1.0) does not ensure that all the product or service being received is within the specifications. A process can have a Cp > 1.0 and produce no product or service within specifications. In addition, Cp values can’t be calculated for one- sided specifications. A better measure of process capability is Cpk.
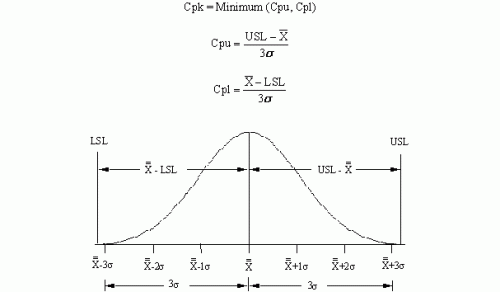
Cpk takes into account where the process is centered. The value of Cpk is the minimum of two process capability indices. One process capability is Cpu, which is the process capability based on the upper specification limit. The other is Cpl, which is the process capability based on the lower specification limit. Algebraically, Cpk is defined as shown in the figure.
Both Cpu and Cpl take into account where the process is centered. The value of Cpk is the difference between the process average and the nearest specification limit divided by three times the standard deviation. It should be noted that the standard deviation is the standard deviation based on an R or s chart – not the standard deviation of the individual measurements.
Cpk values above 1.0 are desired. This means that essentially no product or service is being produced above USL or below LSL. The figure above shows how the Cpk values are calculated. If Cpk is less than 1.0, this means that there is some product being produced out of specification. If there is only one specification, the value of Cpk is either Cpu or Cpl, whichever is appropriate for the specification.
Cpk Example
A bagging operation is designed to place 50 pounds of sand into each bag. The specifications for the operation are a minimum of 49.5 pounds and a maximum of 50.5 pounds. So, the lower specification limit (LSL) is 49.5. The upper specification limit (USL) is 50.5 pounds.
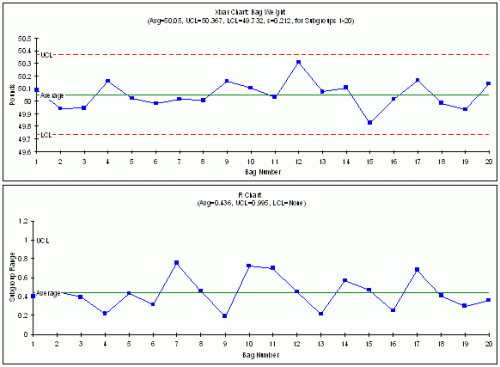
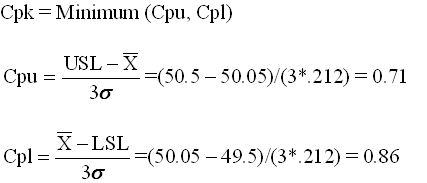
The operation is being monitored using an Xbar-R chart with a subgroup size of 4. Each hour, four consecutive bags are weighed. The subgroup average and range are calculated and plotted on an Xbar-R chart. The control chart is shown in the figure and is in statistical control (see the April 2004 e-zine on our website for information on how to interpret control charts). The standard deviation (from the range chart data) is 0.212. The average bag weight is 50.05. The calculations for Cpk are shown below. Since Cpk is the minimum of Cpu and Cpl, Cpk = 0.71.
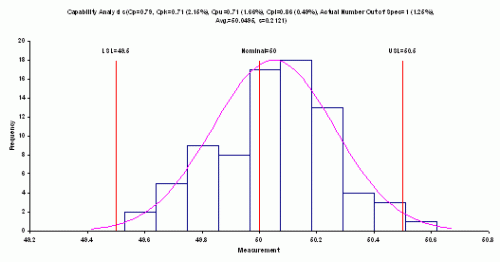
Cpk Chart
As can be seen from the Cpk chart above, the process is not capable of meeting specifications. There will be material below LSL (since Cpl is less than 1) and above USL (since Cpu is less than 1). There was only one actual point that was out of specification. Remember, to do a process capability analysis, the individual measurements should be normally distributed and the process should be in statistical control.
Summary
This month’s newsletter introduced Cpk as a measure of process capability. It is the smaller of the capability based on the upper specification and the capability based on the lower specification limit. It can be used with one-sided specifications.


