In this issue:
Have you ever completed a cause and effect (fishbone) diagram and then not known how to get down to the root causes? This month we examine how to easily analyze the cause and effect diagram. Last month we looked at how to construct a fishbone diagram. The cause and effect diagram is a good tool to use to summarize the causes of variation in our process and to begin the search for root causes.
Cause and Effect Diagram Example
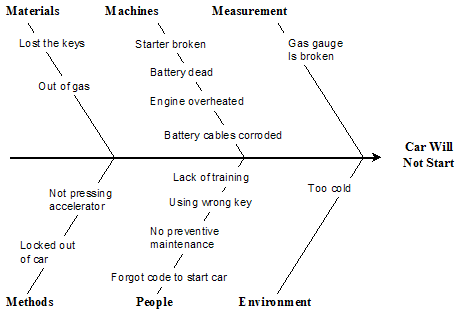
Once all the ideas have been added to the fishbone diagram, the next step is to discuss the ideas and clarify any ideas that are not clearly understood. For example, suppose your team has brainstormed possible causes of why the car will not start. A possible fishbone diagram is shown here.

Eliminate Non-Causes
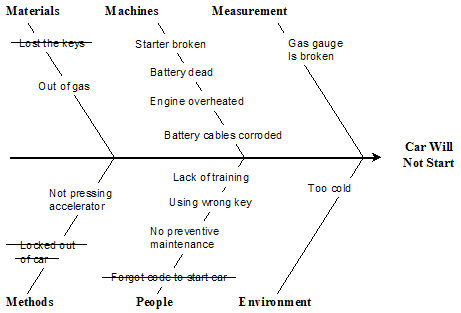
The next step is to eliminate the ideas that everyone agrees would really not cause the problem. Everyone must agree. If one person does not agree, it must stay on the diagram as a possible cause. For example, suppose we know we have the key to the car. We could simply strike through that cause as shown in the fishbone. We have decided a couple of other “potential” causes of the car are not really causes. A line is drawn through those causes as well.

A word of caution: even though an idea is eliminated as a possible cause, it is best to leave it on the fishbone diagram. You may circle it or strike through it. However, always keep the fishbone diagram with all the ideas on it. This will allow you to return at a later date to determine if you have eliminated true causes of the problem.
How Likely?
The next step is to examine each idea and determine the degree to which the idea is an actual cause of the problem. There are numerous ways this can be accomplished. If there are not many ideas, consensus could be reached by discussing each idea individually. However, if there are many ideas on the fishbone, a “straw” vote can be used to determine the degree to which that idea is an actual cause of the problem.
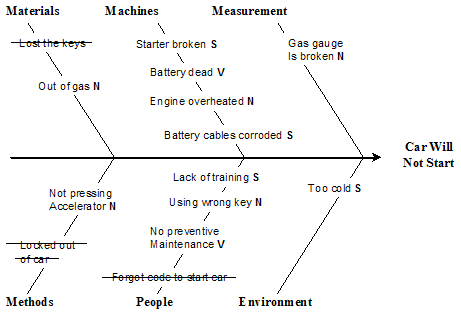
In a straw vote, each team member may vote as many times as he or she wishes. Even though this sounds as if deadlock will happen, it seldom does. Instead, each team member begins to understand where others see root causes to be. For each idea on the fishbone, each team member “votes” one of the following for how likely the listed idea is to be a cause of the problem:
* Very likely (V)
* Somewhat likely (S)
* Not likely (N)
Whichever answer receives the most votes, the corresponding letter (V, S or N) is noted beside that cause on the fishbone diagram.
For example, the team decided that “No gas” was not a likely cause because they knew gas was in the car. So, “No gas” gets a “N” for not likely. This process is repeated for each item on the fishbone.

How Easy?
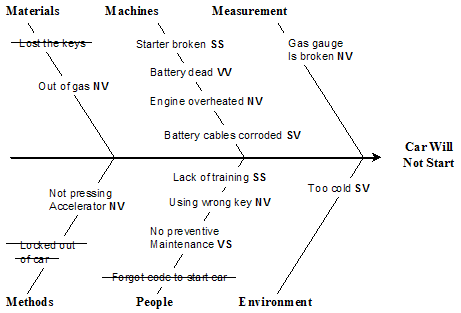
The next step is to determine how easy it is to check or verify the cause. For each item on the fishbone, team members decide how easy it is to verify that item as the cause of the problem, using the following rating scale:
* Very easy (V)
* Somewhat easy (S)
* Not easy (N)
Again, the answer receiving the most votes is noted beside the first response. The causes that receive VV responses are investigated first since these are most likely to the be the cause of the problem and are the easiest to check. In this case, the “Battery” received the only VV.

Data should be collected to verify that the selected idea is the actual cause of the problem. How this is done depends on the cause and effect relationship you are investigating. A scatter diagram may be appropriate, for example. Once the data have been collected and analyzed, it can be determined if the idea is the actual cause of the problem. If it is, a solution should be developed and implemented.
Once the solution is implemented, data should be collected to ensure that the problem was solved. It is possible that the problem was not corrected or only partially corrected. It may be that the wrong cause was selected or the wrong solution implemented. The original fishbone diagram should then be reviewed to determine what other causes should be investigated.
Summary
This publication describes how to analyze a cause and effect (fishbone) diagram. The diagram is analyzed by asking two questions: how likely is item to be the cause of the problem (very, somewhat, not) and how easy is it to verify that it is the cause of the problem (very, somewhat, not). The items that are “VV” are examined first.