April 2015


Lots of control charts out there. This month’s publication takes a look at how individuals control charts can be used for count data – and what differences there are between the individuals control chart and the attribute control charts. In other words, can individuals control charts be used in place of attribute control charts? If so, there is less to train people on and less to learn.
In this issue:
You can download a pdf version of this publication here.
Attribute Control Chart Review
Our April 2009 publication summarizes the four attribute control charts. In addition, we have individual publications for each one of the four attribute control charts. Attributes control charts are based on one of two types of attributes data: yes/no and counting.
With yes/no data, you are inspecting an item. There are only two possible outcomes for each item: either it passes or it fails some preset specification. Each item inspected is either defective (i.e., it does not meet the specifications) or is not defective (i.e., it meets specifications). Examples of the yes/no data are phone answered/not answered, product in spec/not in spec, shipment on-time/not on-time and invoice correct/incorrect.


If have counting data, you would use a c control chart or a u control chart. The c control chart would be used if the area stayed constant from sample to sample; the u control chart would be used if the area did not stay constant.
The key thing to remember with attribute control charts are that there are some conditions that must be met BEFORE the attribute control charts can be used. Too many people do not know this or just ignore it. These conditions are from Advanced Topics in Statistical Process Control (Dr. Don Wheeler).

-
The area of opportunity for defective items to occur must consist of n distinct items
-
Each of the n distinct items is classified as possessing or not possessing some attribute
-
Let p be the probability that an item has the attribute; p must be same for all n items in a sample
-
The likelihood of an item possessing the attribute is not affected by whether or not the previous item possessed the attribute
For counting data, the following conditions must be met.
-
The counts must be discrete counts
-
The counts must occur in a well-defined region of space or time
-
The counts are independent of each other, and the likelihood of a count is proportional to the size of the area of opportunity
-
The counts are rare compared to the opportunity

The p and np control charts are based on the assumption that the underlying distribution is the binomial distribution. The c and u control charts are based on the assumption that the underlying distribution is the Poison distribution. If the above conditions are not met, then the control limit calculations for the attribute control charts are not valid.
For example, the control limits for the np control chart are given by:
where n = subgroup size, np is the average number defective and p is he average divided by n.
These control limits specify how far away from the average the control limits are – and they are a function of the average. The control limits for the c control chart are given below:
where c is the average number of defects.
Again, the distance the control limits are from the average depend on the average itself. You will see this is not true for the individuals control chart. The attribute control limits are theoretical control limits. This is explained in more detail in our April 2009 publication.
Individuals Control Charts Review
We covered individuals control charts (X-mR) in our October 2006 publication. With this type of chart, you are plotting the X values over time on the X control chart and the moving range between consecutive samples on the moving range control chart. The averages and control limits are calculated. The control limits are based on the moving range between consecutive points. The control limits for the X-mR control chart are given below.
UCLx = X + 2.66R
LCLx = X – 2.66R
where X is the overall average for X and R is the average moving range.
Note that there is no relationship between the average and the distance the control limits are from the average. That distance is determine by the average moving range. These are empirical control limits, i.e., they are based observation rather than theory. The restrictions on using the attribute control charts do not apply to the individuals control chart.

Individuals Control Charts vs the np Control Charts
Remember the red bead experiment. The red bead experiment is an example of yes/no data that can be tracked using an np control chart. In this experiment, each worker is given a sampling device that can sample 50 beads from a bowl containing white and red beads. The bowl contains about 80% white beads and 20% red beads. The objective is to get all white beads. In this case, a bead is “in-spec” if it is white. It is “out of spec” if it is red. So, we have yes/no data – only two possible outcomes. In addition, the subgroup size is the same each time, so we can use an np control chart.
Data from one red bead experiment are shown below in Table 1. The numbers represent the number of red beads each person received in each sample of 50 beads.
Table 1: Red Bead Experiment Results
| Worker | Day 1 | Day 2 | Day 3 | Day 4 |
|---|---|---|---|---|
| Tom | 12 | 8 | 6 | 9 |
| David | 5 | 8 | 6 | 13 |
| Paul | 12 | 9 | 8 | 9 |
| Sally | 9 | 12 | 10 | 6 |
| Fred | 10 | 10 | 11 | 10 |
| Sue | 10 | 16 | 9 | 11 |
Does this situation satisfy the four conditions for using an np control chart?
-
The area of opportunity for defective items to occur must consist of n distinct items – yes, the sampling bowl contains a set number of items.
-
Each of the n distinct items is classified as possessing or not possessing some attribute – yes, the bead is either red or white
-
Let p be the probability that an item has the attribute; p must be same for all n items in a sample – yes, the probability of a bead being red or white is the same for all items
-
The likelihood of an item possessing the attribute is not affected by whether or not the previous item possessed the attribute – yes, the fact that a bead is white has no effect on the other beads in the sampling box.
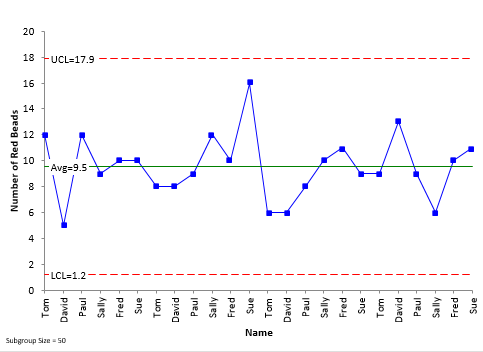
So, we can use the np control chart for these data. The np control chart for the data is shown in Figure 1. The np values (the number of red beads in each sample) are plotted along with the average number and the control limits.
Figure 1: np Control Chart for Number of Red Beads
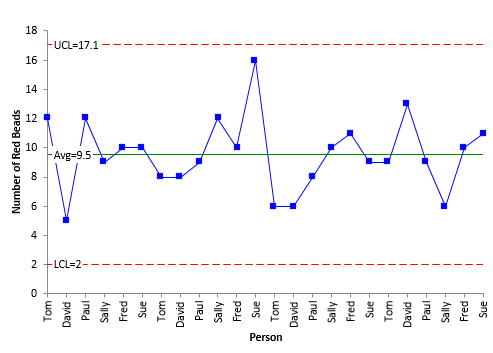
The average number of red bead per sample is 9.5. The upper control limit is 17.9 and the lower control limit is 1.2. What would the same data look like as an individuals control chart? This is shown in Figure 2 (we will ignore the moving range control chart here).
Figure 2: Individuals (X) Control Chart for Number of Red Beads
Note that the same points are plotted on each chart and that the average for the X control chart is the same as for the np control chart. The only difference between these two charts is how the control limits are calculated.
The np control chart uses the binomial distribution to find the control limits, while the individuals control chart uses the average moving range. On the X control chart, the UCL is 17.1, compared to 17.9 on the np control chart, and the LCL is 2.0, compared to 1.2 on the np control chart.
So, there appears to be very little difference between using the individuals control chart and the np control chart. So, why have to worry if the control limits are “theoretically” correct with the np control chart. Just use the individuals control with the “empirical” control limits.
Individuals Control Charts vs the c Control Charts
Consider the data in Table 2 for the number of defects. These data were generated randomly for Poisson distribution with an average of 5.
Table 2: Number of Defects Data
| Sample | Defects | Sample | Defects | |
|---|---|---|---|---|
| 1 | 3 | 11 | 8 | |
| 2 | 7 | 12 | 2 | |
| 3 | 6 | 13 | 6 | |
| 4 | 4 | 14 | 5 | |
| 5 | 9 | 15 | 6 | |
| 6 | 5 | 16 | 7 | |
| 7 | 2 | 17 | 5 | |
| 8 | 5 | 18 | 8 | |
| 9 | 3 | 19 | 7 | |
| 10 | 5 | 20 | 1 |
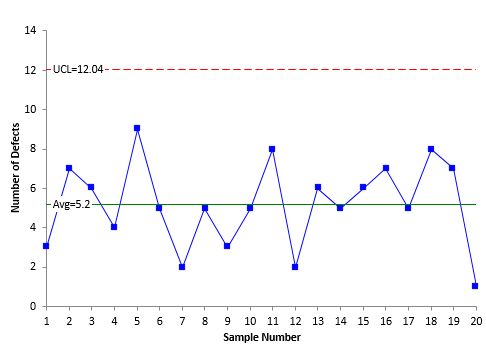
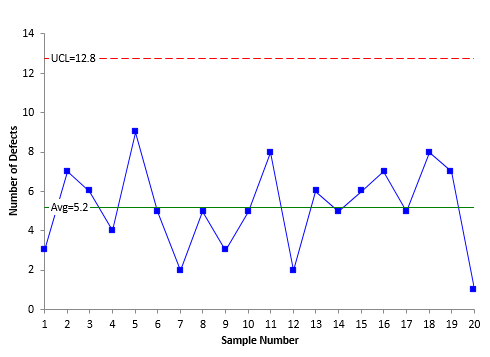
The c control chart based on these data is shown in Figure 3. The individuals control chart is shown in Figure 4.
Figure 3: c Control Chart for Number of Defects
Figure 4: X Control Chart for Number of Defects
The average in both charts in Figure 3 and 4 is 5.2. Again, the only difference is the way the control limits are calculated. The UCL is 12 for the c control chart and 12.8 for the X control chart. Once again, there is very little difference.
Summary
This publication took a look at the difference between the individuals control chart and attribute control charts – in particular the np and c control charts. The charts are very similar – the same data are plotted on each chart and the same average is obtained. The difference is in how the control limits are determined. The np and c control limits are based on the assumption that you have a certain theoretical distribution. This is not the case for the individuals control chart where the control limits are based on a moving range – independent of any theoretical distribution. The results are essentially the same.


