October 2006
In this issue:
- Introduction
- X Chart
- Moving Range Chart
- Statistical Control
- When to Use
- Steps in Constructing
- Example: Waiting in Line
- X Chart – Example
- Moving Range Chart – Example
- Summary
- Quick Links
Suppose your process generates data on a very limited frequency. Maybe you only get data once a day, once a week, or once every two weeks. How can we apply control charts to these types of data? If we wait to get several data points to form a subgroup, we won’t be able to plot a point very often. Perhaps the test method used to analyze the process is very expensive to run or takes a long time. How can we handle this type of situation? In these instances, individuals control charts are useful. This type of chart is useful when you have only one data point at a time to represent a given situation. The individuals control chart is introduced in this publication.
Introduction
The individuals control chart is a type of control chart that can be used with variables data. Like most other variables control charts, it is actually two charts. One chart is for the individual sample result (X). The other chart is for the moving range (R) between successive individual samples. The individuals chart is very useful for monitoring processes where data are not available on a frequent basis. The individuals control chart examines variation in individual sample results over time. While rational subgrouping does not apply, thought must be given to when the results will be measured. If the process is in statistical control, the average on the individuals chart is our estimate of the population average. The average range will be used to estimate the population standard deviation.
The individuals control chart is a method of looking at variation. One source of variation is the variation in the individual sample results. This represents “long-term” variation in the process. The second source of variation is the variation in the ranges between successive samples. This represents “short-term” variation.
X Chart
 The figure in this section is an example of an X chart for individual results. In this example, a sample is pulled once a day from a given process stream and tested for a certain contaminant. Since data are not obtained very frequently, an individuals control chart was selected. On the first day the test method indicated that there were 105 ppm of the contaminant in the product stream. On the second day, the sample result was 93 ppm. The overall process average has been calculated and plotted as a solid line. The upper and lower control limits have also been calculated and plotted as dashed lines.
Moving Range Chart
 The figure in this section is the moving range chart that goes with the X chart. This chart represents the range between successive data points. This range is often called a moving range. The range value plotted for the second day is simply the range between day 1 and day 2 (largest minus smallest). This range is 105 – 93 = 12. The average range has been calculated and plotted as a solid line. The upper control limit has also been calculated and plotted as a dashed line. There is no lower control limit on the range chart for an individuals chart.
Statistical Control
The charts above are in statistical control. What does it mean when the individuals control chart is in statistical control? It means that the individual sample results are consistent over time, i.e., they are not significantly different from the process average. It also means that the difference between successive sample results is consistent over time. We can predict what the process will make in the near future. For more information on interpreting control charts, please see our April 2004 publication on our website.
When to Use
Individuals control charts should be used when there is only one data point to represent a situation at a given time. The individuals control chart allows you to plot a point on the chart for each sample taken. This permits you to determine if the process is in statistical control or not for each sample taken. This may seem to imply that you should always use individuals charts. That is not necessarily true as is discussed below.
To use the individuals control chart, the individual sample results should be “somewhat” normally distributed. If not, the individuals control chart will give more false signals for the tests such as the zone tests, i.e., will indicate more often that the process is out of control when it actually is not.
Individuals control charts are not as sensitive to changes as Xbar-R charts. In addition, values of X and R can have significant variation (even though the process is in control) until the number of individual data points reaches 100.
Steps in Constructing
 The steps in constructing the individuals control chart are given below.
1. Gather the data.
a. Select the frequency with which the data will be collected. Data should be collected in the order in which they are generated.
b.Select the number of data points (k) to be collected before control limits are calculated (at least twenty). These will be tentative limits. Control limits should be recalculated after you have collected 100 data points.
c. Record the individual sample results.
d. Calculate the moving range (Ri+1) between consecutive sample results:
Ri+1 = |Xi+1 – Xi|
where Xi+1 is the result for sample i+1 and Xi is the result for sample i. The range value is always positive.
2. Plot the data.
a. Select the scales for the x and y axes for both the X and R charts.
b. Plot the ranges on the R chart and connect consecutive points with a straight line.
c. Plot the individual sample results on the X chart and connect consecutive points with a straight line.
3. Calculate the overall process averages and the control limits.
a. Calculate the average moving range (Rbar):
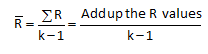
Note there is always one less range value than individual sample results for the individuals control chart.
b. Plot Rbar on the range chart as a solid line and label.
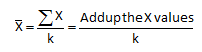
c. Calculate the overall process average (X):
d. Plot X on the X chart as a solid line and label.
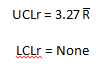
e. Calculate the control limits for the R chart. The upper control limit is given by UCLr. The lower control limit is given by LCLr.
f. Plot the upper control limit on the R chart as a dashed line and label.
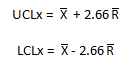
g. Calculate the control limits for the X chart. The upper control limit is given by UCLx. The lower control limit is given by LCLx.
h. Plot the control limits on the X chart as dashed lines and label.
4. Interpret both charts for statistical control.
a. Always consider variation first. If the R chart is out of control, the control limits on the X chart may not be valid since you do not have a good estimate of Rbar.
b. All tests for statistical control apply to the X chart. However, the data on the range chart are not independent. Each data point is used twice. The only test that is valid for the range chart is points beyond the control limits.
5. Calculate the process standard deviation, if appropriate.
a. If the R chart is in statistical control, the process standard deviation,
s, can be calculated as:

Example: Waiting in Line

Waiting in line at a bank can be very frustrating. Your bank has just implemented a promise that your wait in line will never be longer than five minutes. You decide to find out if this is really true. Since you only go to the bank about once a week, you have infrequent data. You feel that the individual measurements (time waiting in line) are probably a normal distribution (waiting in line is usually not normally distributed, but we will assume for this example). You decide to use an individuals/moving range chart to determine if the bank is keeping its promise. Each time you go to the bank, you measure how long you wait in line to the nearest 0.1 minute. The results for 24 trips to the bank are given below.
| Trip | Waiting in Line |
| 1 | 3.5 |
| 2 | 2.4 |
| 3 | 4.1 |
| 4 | 2.8 |
| 5 | 3 |
| 6 | 4.7 |
| 7 | 1.2 |
| 8 | 0.9 |
| 9 | 2.5 |
| 10 | 3.1 |
| 11 | 3.6 |
| 12 | 4.1 |
| 13 | 3.8 |
| 14 | 2.5 |
| 15 | 2.8 |
| 16 | 4.3 |
| 17 | 4.1 |
| 18 | 3.6 |
| 19 | 2.4 |
| 20 | 4.8 |
| 21 | 3.5 |
| 22 | 2.5 |
| 23 | 1.3 |
| 24 | 4.5 |
The first step after collecting the data is to calculate the moving range between trips to the bank. For example, the moving range is the range between trips 1 and 2 is:
Ri+1 = |Xi+1 – Xi|=3.5 – 2.4 = 1.1
This is done for each consecutive trips. The moving range between trips 2 and 3 is |2.4 – 4.1| = 1.7. Remember, the range is always positive.
The next step is to calculate the overall process average and the average range. The overall process average is determined by adding up the individual results for each trip and dividing by the number of samples (trips). In this case, the number of trips (k) is 24. The average range is determined by adding up the moving range values and dividing by k- 1 since there is one less range value than individual samples.
Xbar = 76/24 = 3.17
Rbar = 27.4/23 = 1.19
The next step is to calculate the control limits. The control limits are:
UCLr = 3.27 Rbar = 3.27(1.19) = 3.89
LCLr = None
UCLx = Xbar + 2.66Rbar = 3.17 + 2.66(1.19) = 6.34
LCLx = Xbar – 2.66Rbar = 3.17 – 2.66(1.19) = 0.005
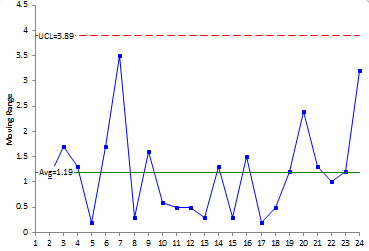
If the moving range chart is in control, the standard deviation of the individual results can be determined. The moving range chart (as shown below) is in control. The standard deviation is then given by:
s‘ = Rbar/1.128 = 1.19/1.128 = 1.05
X Chart – Example
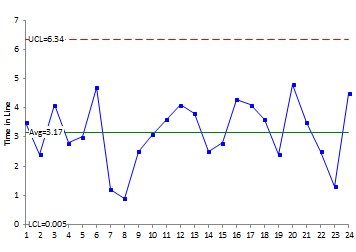
The X chart for waiting in line is shown in this example. The moving range chart is shown below. The process is in control. This means, that as long as the process stays the same, you can predict, within a range, how long you will wait in line when you go to the bank.
This means that, when you go to the bank, you will wait in line anywhere from 0 to 6.34 minutes. What does this mean about your bank’s commitment that you will not wait more than 5 minutes in line? It means that the bank is not capable of meeting that guarantee. You have not waited more than 5 minutes yet based on the data. But it is just a matter of time before you do.
Moving Range Chart – Example
Summary
This publication has introduced individuals control charts. This type of chart should be used when data are infrequently available. The individual measurements should be “somewhat” normally distributed to use an individuals chart. The X chart is examining the long-term variation in individual sample results. The range chart is examining the short-term variation between consecutive sample results. Like all control charts, the individuals chart is used to determine if the process is in statistical control.