February 2009
In this issue:
- Common and Special Causes
- The Red Bead Experiment
- How to Perform the Red Bead Experiment
- A Case Study in Variation
- Quick Links
Greetings,
Understanding variation is the key to successfully using control charts and quality improvement techniques. To effectively use SPC, you must understand the concept of variation, and, in particular, the difference between common and special causes of variation. This will be the sixth time we have visited variation over the past five years of newsletters.
We will focus on using the red bead experiment to demonstrate an in-depth understanding of variation. Have you been trained to use control charts? Did your instructor use the red bead experiment to demonstrate variation? If not, your instructor missed a great way of demonstrating what common and special causes are, how control charts separate the two, and what needs to be done to improve a process.
We will start this newsletter by talking about spilling milk, an example I have used several times in the past to introduce the concept of variation. My mother always used to get upset when I (or my siblings) spilled our milk. Did your mother get upset? Was it your fault? Then, we will introduce common and special causes using the time it takes you to get to work.
Next we will introduce and describe the red bead experiment. We will include several links where you can purchase a bead bowl and supplies (Note: we have no affiliation with these companies). We will also provide a link where you can download a free red bead simulator that runs in
Common and Special Causes
I used to, now and then, spill a glass of milk when I was young. Our table slanted towards where my mother sat. So, the milk always headed in her direction. And she usually had some choice words when this happened. Of course, I was at fault. I needed to be more careful. Or was that really true? If you understand variation, you will realize that most of the problems you face are not due to individual people, but to the process — the way it was designed and the way it is managed daily.
 Variation comes from two sources: common and special causes. Think about how long it takes you to get to work in the morning. Maybe it takes you 30 minutes on average. Some days it may take a little longer; some days a little shorter. But as long as you are within a certain range, you are not concerned. The range may be from 25 to 35 minutes. This variation represents common cause variation – it is the variation that is always present in the process. And this type of variation is consistent and predictable. You don’t know how long it will take tomorrow to get to work, but you know that it will be between 25 and 35 minutes as long as the process remains the same.
Now, suppose you have a flat tire when driving to work. How long will it take you to get to work? Definitely longer than the 25 to 35 minutes in your “normal” variation. Maybe it takes you an hour longer. This is a special cause of variation. Something happened that was not supposed to happen. It is not part of the normal process. Special causes are not predictable and are sporadic in nature.
Why is it important to know the type of variation present in your process? Because the action you take to improve your process depends on the type of variation present. If special causes are present, you must find the cause of the problem and then eliminate it from ever coming back if possible. This is usually the responsibility of the person closest to the process. If only common causes are present, you must FUNDAMENTALLY change the process. The key word is ‘fundamentally’ — a major change in the process is required to reduce common causes of variation. And management is responsible for changing the process.
It has been estimated that 85 to 94% of the problems a company faces are due to common causes; only 6 to 15% are due to special causes (that may or may not be people related). So, if you always blame problems on people, you will be wrong at least 85% of the time. It is the process most of the time that needs to be changed. Management must set up the system to allow the processes to be changed.
So, Mom, sorry. But most of the time, spilling the milk was not my fault. It was usually yours (management). The glasses were too big for my small hands (no spill-proof cups in those days). When I wanted to put it by the edge of the table to make it easier to reach, you said move it back because I might spill it. And with the meal-time conversation, how could I concentrate on my milk?
The Red Bead Experiment
 The most powerful method I know for developing an understanding of variation is the red bead experiment. Dr. W. Edwards Deming often referred to it as a stupid experiment that you’ll never forget. I had the opportunity to see Dr. Deming perform this experiment in a seminar in 1984.
The experiment requires a sampling bowl that contains 80% white and 20% red beads — hence the name “red bead experiment”. You also need a mechanical sampling device such as a paddle containing 50 dimples to hold the beads. You could also use different colored beads as long they make up 20% of the population. Management has developed and purchased this “white bead” process for the working force. There is a major customer that needs white beads and will not accept anything less than 100% white beads. All red beads are considered to be defective. These red beads represent all the things that can go wrong with a process including a mechanical breakdown, a bad design, a poor procedure, an untrained worker, etc.
If you wish to purchase a bead bowl and supplies, below are two websites that sell them (we have no connection with these websites):
www.spcpress.com (under Other Products)
www.qualitytng.com
If you do not have a sampling bowl, you can use the red bead experiment simulator that runs in Excel. You can download it here. The file contains macros that must be enabled. You will also have to ensure that the Excel add-in Analysis Toolpak-VBA is installed.
How to Perform the Red Bead Experiment
The instructions below have been adapted from the Lamar University website. The procedure for running the red bead experiment is given below. Assume that you, the instructor, are the foreman or supervisor. Follow the instructions below adding anything you may want to based on your knowledge of the group.
1. Start by telling the class the following:
- Our company plans on expanding to take care of a new customer.
- This customer needs white beads; he will not take red beads.
- Management has designed and purchased a “white bead” process to do this.
2. Then let the class know you have some positions available:
- Six willing production workers: Must be willing to put forth their best efforts. Keeping their job depends on how well they do. Education is not important – only the ability to follow a few simple instructions. Prior experience not necessary.
- Two inspectors: Must be able to distinguish between red and white beads and count to twenty without taking their shoes off. Prior experience is not necessary.
- One inspector general: Same qualifications as the inspectors. Prior supervisory experience not necessary.
- One recorder: Must write legibly, must be able to add and divide.
- Notes:
- You can adjust these numbers, but use at least four workers, an inspector and a recorder
- It is recommended that you ask for volunteers to fill these roles, although you can select the workers yourself
3. You are now ready to train the workers by saying the following:
- There is a one-day apprenticeship to learn the job.
- During this time you may ask questions.
- Once production starts, there will be no questions, no remarks.
- Just do your job!
- The procedures are rigid and there can be no departure from the procedures; thus we have no variation.
- Your job depends on your performance.
- Our procedures for dismissal are very informal.
- Remember, there are people here ready to take your place.
- There will be no resignations.
- We have work standards here.
- You must make 50 beads per day each day; no more and no less.
- Notes:
- Allow each worker to try the process one time if he or she does not understand it.
- Point out that you are never allowed to touch the beads with your hands.
4. Instruct the inspector and recorder in their jobs.
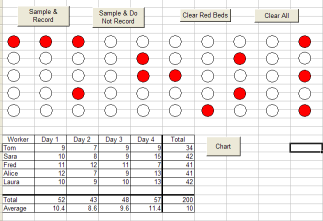
- The recorder writes down the names of the workers on the data collection sheet which should be written on a flip chart so everyone can see the results.
- The recorder will write down the number of red beads each worker gets each day.
- The recorder will calculate the cumulative average each day.
- The recorder will calculate the total red beads for each worker at the end of the experiment.
- The inspectors stand far enough away from each other that they can’t easily see what the other is doing.
- The inspectors only give their count to the recorder when instructed by the foreman.
- If the two inspectors do not agree on the number of red beads, the inspector general must decide which count is correct
- Notes:
- It is very important that the inspectors are independent and cannot see what the other has counted
5. Start the actual experiment following the order of the names listed on the data collection sheet. Note: for 20% red beads with a paddle with 50 indentations, the number of red beads that are drawn each time will be between 1 and 19. You want to have at least 16 to 24 samples so you can make the following points. What points you make will depend on the numbers that the experiment generates.
- Clear Instructions
- Start with this point. Suppose Joe is the first person. Ask Joe if he understands the instructions and was trained properly (of course, you were the trainer and you are his supervisor, so he had better answer yes!).
- Then Joe draws. Suppose he has 10 red beads. Ask Joe if he followed the instructions correctly. Were they too difficult? Did you slowly dip the paddle in? Joe will probably say he did everything right. Tell him he must not have been listening.
- Suppose Carol is next. Ask Carol to please make a batch of white beads.
- Suppose Carol gets fewer than Joe, maybe eight red beads. You can say, “Well, Carol, that is better than Bob, but you must not have been following instructions either.” Repeat the instructions.
- Now ask the next person to please run this process. Remind him that the customer only wants white beads – no red beads. Suppose the next person is Tom. Maybe he gets 14 red beads. As the boss, you just shake your head and wonder aloud how there can be all of this variation when there are clear instructions and everyone has been trained.
- Ranking the Workers
- At the end of the first day, someone will be the best and someone will be the worst (or there may be a tie).
- Shake the hand of the person that did the best. Point out that there were still red beads in the product, but he or she did better than anyone else. Give this person a reward – like the choice parking spot for the next day.
- Give the person who had the most beads a stern warning. He or she may be written up or given time off if there is no improvement
- Notes:
- At the end of the second day, go back to this process because the following often happens:
- The person who had the fewest red beads did the worst the second day. Shake your head and wonder aloud about how this could happen – you gave him or her something good and the performance got worse
- The person who had the most red beads did better the second day. Nod your head, yes, this is because you are such a great supervisor and had a talk with that person the day before!
- Comparing the Workers
- Based on the results, make comparisons between workers (similar to the ranking above) and their performances.
- Suppose Joe improves from one day to the next. Tell him that he is improving and must understand all about continuous improvement.
- Suppose Carol gets worse from one day to the next. Make some comments about how she can’t get better from day to day even with experience.
- Suppose Joe is getting better results than Carol. Compare the two: e.g., Joe is twice as good as Carol. “Carol, watch what Joe is doing so you can improve.”
- Banners and Slogans
- At the end of day two, wonder aloud why things are not better. Then say you have been doing some reading and read that slogans help people do better. Then show the group some prepared slogans on flip charts. Examples include:
- The word red inside a circle with a line through it to represent no red beads.
- “Be red, be dead.”
- “Customer Satisfaction is number one with us!”
- Continue through the third day, reinforcing the slogans each time.
- The day’s results may be better or worse. If better, say “These slogans helped some, but not enough.” If worse, say, “These slogans don’t help at all.”
- Incentives
- At the start of the fourth and last day, tell the workers that the customer is threatening to fire us for non-performance. This is our last chance. And you have heard that financial incentives are what really motivate people. So, you are offering $20 to anyone who can get 100% white beads. Take out a $20 bill and show it to everyone (don’t worry too much about losing it; 100% white beads will occur only about one time in 70,000 samples).
- Customer Complaints
- At the end of the fourth day, tell the workers that the customer has gotten tired of their producing red beads and has gone to another supplier.
- “As a result, we no longer need the white bead process and all of you lose your jobs.”
6. Debrief the Exercise
- Thank those who participated in the experiment.
- Ask the group to record the info on the data collection sheet in their workbook
- Ask how some supervisors react when faced with problems. Points to make include:
- Joe must be the worst since he had the most red beads over the four days. We can improve the process just by getting rid of Joe.
- Carol is the best; she had the fewest red beads. We can make her the trainer for the rest of the workers.
- This approach of blaming people and comparing people does not work.
- The first question you should ask yourself when you are faced with a problem is: What is the state of control of the process that generated this problem?
- The answer to this question will tell you where to begin to work on solving the problem.
- If the problem was a special cause of variation, you should look for the one event that caused the problem to occur and eliminate it from ever occurring again. If everyone is doing it (producing red beads), it is not special cause.
- If the problem was due to common causes (like the red beads), you must examine the entire process and make fundamental changes to the process to keep the problem from occurring again.
- Chart the data and make an np control chart using the actual data. The control limits will be close to 1 and 19 with the average around 10.
- Point out that this system is rigged. Obviously you can’t get zero red beads, and people know this. But they still do the best they can and want to perform well. This is human nature.
7. Cover the lessons learned from the red beads as explained in The New Economics by W. Edwards Deming
- Thoughts from a Willing Worker named Ann:
- “When I was a Willing Worker on the Red Beads, I learned more than statistical theory. I knew that the system would not allow me to meet the goal, but I still felt that I could. I wished to. I tried so hard. I felt responsibility: others were dependent on me. My logic and emotions conflicted, and I was frustrated. Logic said that there was no way to succeed. Emotion said that I could by trying. After it was over, I thought about my own work situation. How often are people in a situation that they cannot govern, but wish to do their best? And people do their best. And after a while, what happens to their drive, their care, their desire? For some they become turned off, tuned out. Fortunately, there are many that only need the opportunity and methods to contribute with.”
- The system turned out to be stable (in control). The variation and level of output of the Willing Workers was predictable. Costs were predictable.
- All the variation came entirely from the process itself. There was no evidence that any one worker was better than another.
- The output (white beads) showed statistical control, the process was stable. The workers had put into the job all that they had to offer. They could, under the circumstances, do no better.
- The ranking of people, as is done in the merit system or in the appraisal of people, is wrong and demoralizing, as it is actually ranking the effect of the process on people.
- Pay for performance is futile. The performance of the Willing Workers was governed totally by the process in which they worked.
- Management, in giving out praise and punishment, was rewarding and punishing the performance of the process, not the Willing Workers.
- The red bead experiment was a display of bad management. Procedures were rigid and the Willing Workers had no chance to offer suggestions for improvement of output.
- On the job, everyone has the obligation to improve the system and thus to improve his own performance and that of everyone else. The Willing Workers were victims. They could not, under the rules laid down by management, improve their performance.
- There was no basis for management’s supposition that there was a best worker each day.
8. Have fun!!
A Case Study in Variation
To really understand variation, many people have to change their paradigm. The following is a true story. A plant produced a number of different powdered products. Each of these products was run through the same production equipment at different conditions and put into unique silos (one or more for each product type).
To ensure that the product went to the correct silo, an operator had to set up the lines from the process to the correct silo. If product was introduced into the wrong silo, the entire silo had to be sold as off- grade, at a tremendous reduction in price. The cost was typically $30,000 per incident.
The plant leadership had a policy that anyone who cross-contaminated a silo received three days off with no pay. What type of variation did leadership assume was present? Special cause. They assumed that the operators were at fault. One manager said that he was not going to “idiot proof” the plant.
Was leadership correct? The only way to find out is to collect data.
It turns out that anyone who had worked in the unit for more than three months had time off for cross-contaminating a silo. If everyone is doing it, what type of variation is it? Common cause. And the only way to reduce common cause of variation is to change the process.
Leadership put together a team that worked on the problem. The team came up with two simple solutions: label the lines and put better lights out at night. Easy solutions but beyond the authority of the operators to get done by themselves. With the solutions implemented, the problem, which had been occurring almost monthly, went away entirely. So simple if you understand variation.