Analysis of Variance (ANOVA)
Home » SPC for Excel Software » Analysis of Variance (ANOVA)
Our SPC software, SPC for Excel, performs ANOVA for one to five factors. ANOVA allows you to determine if there are significant differences between treatments.The software contains crossed, nested or mixed designs – as well as fixed or random factors. The runs can be randomized.
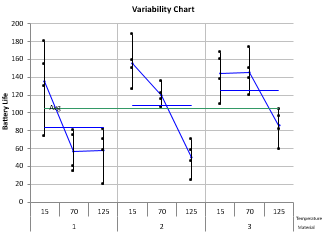
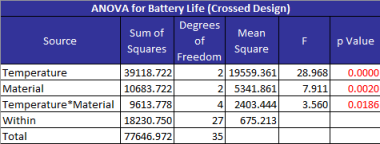
The output includes the ANOVA table for the factor and for the model. Also included is the variability chart – a chart that shows each run at each level of the factors. This chart is easily revised to switch factor levels or can be colored-coded by factor. A complete list of ANOVA features is given below.
Watch a Video Highlighting SPC for Excel's Analysis of Variance (ANOVA) Methodology
Join those in over 80 countries using SPC for Excel!
ANOVA Features
- One to five factors
- Crossed, nested or mixed designs
- Fixed and/or random factors
- Multiple responses
- Randomization of runs
- Option to visualize design
- 1 to 25 Replications
- ANOVA table for factors
- ANOVA table for models
- Statistics
- Average
- Standard deviation
- Coefficient of variation
- R square
- Adjusted R square
- 95% confidence intervals for treatment means (fixed factors)
- Comparison of treatment means and variances (fixed factors)
- Treatment means
- Treatment variances
- Variability Plots
- Plots each treatment versus factor levels
- Option to plot treatment averages and overall averages
- Option to re-order factors on plot
- Option to color-code by a factor's levels
- Components of Variance Plots
- % of total by factor
- Estimates of variance and standard deviation by factor
- Xbar and R/s charts
- Xbar: Plots treatment means
- R: plots treatment ranges
- s: plots treatment standard deviations
- Expected Mean Squares
- F Calculation Information
- Source, error degrees of freedom, error mean square, error mean square calculation
- Rollup Control Charts
- Rollup control charts (primarily for nested designs)
- Residuals analysis
- Residuals
- Leverage
- Standardized residuals
- Internally studentized residuals
- Externally studentized residuals
- DFFITS
- Cook's distance
- Potential outliers in red
- Residuals charts (raw, standardized, internally or externally studentized residuals)
- Normal plot
- Versus predicted values
- Versus actual run number
- Other charts
- Predicted vs actual
- DFFITS, Cook's distance and leverage versus actual run number
- p values < 0.05 in red