Control Charts
Home » SPC for Excel Software » Control Charts
With Control Charts in SPC for Excel You Can:
- Show that your process is in statistical control
- Easily add new data to update the control chart
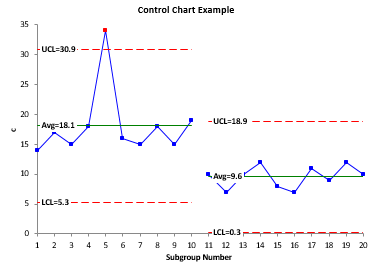
- Split the control limits to show process improvements
- Lock the control limits in place for future data
- and much more!
See What Control Charts in SPC for Excel Can Do!
Why Use Control Charts in SPC for Excel?
Our goal has been to create a control chart software package that gives you all the options you need to determine if your process is in statistical control, and to improve and manage your processes.
- The SPC for Excel software has over 30 different charts
- Large number of options to meet each of your process improvement needs
- Easy select and create charts in Excel
- Add data, update and share your work
- Multiple tools for data analysis, simple yet powerful
Love that there are a full range of control charts in there – and it is simple to use. This was the reason I wanted our organization to purchase your product – cost effective, useful and easy to use. I also love the website which is full of useful information especially relating to when and how to use a control chart – and you include examples from healthcare! This is often so hard to find – and healthcare is such a different industry than say, manufacturing, sometimes it is hard to see where a control chart may assist in quality improvement and monitoring.
Sara M.
SPC for Excel is an exceptional tool for the presentation and analysis of data. This valuable tool is quick, easy and intuitive for the statistical beginner to the most advanced user. This version is another example of the Voice of the Customer at work. The improved charting capabilities along with the inclusion of shortcuts to make presenting and reporting the data easier takes SPC for Excel to a higher level. Just type the data into Excel, the program can coach users in the proper formatting and selection of charts. As a Six Sigma Black Belt I have used this great tool to support the completion of numerous projects. It is versatile as well as highly capable. This version has phenomenal enhancements that will make stronger analytical tools available to anyone with Excel.
Walt WilsonCertified Six Sigma Black Belt
I like the SPC software – thanks for making this program for excel. It filled a need I had for a statistics tool that I was familiar with having run six sigma projects for years but now just require the tools occasionally. I also wanted to mention that your customer help service was really good. I left a chat note and you got back to me promptly and with good follow-up which let me get the programme downloaded quickly. That helped me a lot as I needed to get something out later that day so I was able to use the program immediately. I think that is important when people are searching for new programs – it's often to fill an immediate need but then can develop into a long term use.
Maureen M.
Would you believe it that today is the day that we go for our ISO 9000:2001 certification audit and the process capability charts I generated using your program actually saved the day for me? From the moment I downloaded your program, I only stop churning out the charts for quick bites and the short sleep that I needed. I generated the Cpk charts for all the lab test results for all the resin properties such as K-value, Apparent Density, Particle Size, Moisture, Plasticizer Absorption, Color, Heat Stability, etc. The lead auditor was very impressed with the charts and the analyses and the conclusion we deduced from them.
Akbar Md. ThayoobPhu My Plastics & Chemicals Co., Vietnam
Love that there are a full range of control charts in there – and it is simple to use. This was the reason I wanted our organisation to purchase your product – cost effective, useful and easy to use. I also love the website which is full of useful information especially relating to when and how to use a control chart – and you include examples from healthcare! This is often so hard to find – and healthcare is such a different industry than say, manufacturing, sometimes it is hard to see where a control chart may assist in quality improvement and monitoring.
Sara M.
I recently purchased BPI Gage R&R and am extraordinarily pleased with it. I have been tasked with resuscitating our MSA program here and had thought that our gage management software's GR&R feature would do the trick. I was concerned when an auditor pointed out some questionable math in software and imagine my shock when a rep from the software vendor told me it was fine! Re-running past studies through your Excel add-in software gave me the results based on math from Measurement Systems Analysis from AIAG.... results that differed from the other software. These results are the true reflection of our systems and I am pleased with the ease-of-use your software provides. Thank you again for a great product.
Kevin WoolseyQuality Supervisor
I like the interface and the familiarity that comes with an excel package, and the price as you say is a fraction of some products.
Christian C.
This is very cool! Once again you have outdone yourself. I like the way it automatically names the tab now. The export buttons to PowerPoint and Word are great! And at last, an easy way to add a target to the chart. Plus, the option to construct the X chart only is super
Randy DavisMayer Electric Company
I like that it works within Excel as an add-in so I don't have to download something extra. I also really appreciate all the online help offered and the reasonable price.
Douglass B.
With this SPC program, I can chart almost all aspects of my operation from shop floor quality to service level performance. I can easily spot trends, identify special cause situations and evaluate how process changes affect operations. Since I started using this program, our company has achieved improved performance levels in all areas charted.
Larry JamesOperations Manager, Stanley Works
I personally use SPC for Excel to analyze key aspects of sales, marketing, and customer service performance for my clients and in my sales process research. Bill’s program is easy to use and the price makes it a non-issue.
Paul SeldenPh.D., CQE
I have personally used SPC for Excel for over five years. It is an absolutely fantastic tool to help bring SPC methods and measurement principles to the workplace. With this software, we have been able to remove much of the drudgery of SPC. It has made a difference for us and will continue to do so as more of our associates are introduced to SPC the smart way.
Keith BennettMayer Electric Supply
Our organization has made a commitment to process measurement as a key business tool. SPC for Excel allows us to effectively take SPC to all levels of the organization with its flexibility and ease of use. We value the view of process performance that the program provides.
Carol L. MarksC.P.M., Director of Purchasing, Industrial Distribution Group
Previous
Next
Join Those in Over 80 Countries Using SPC for Excel! 30+ Control Charts in SPC for Excel
Subgroup Averages
- X-R
- X-s
- X
- R
- s
- Median-R
- Median
Individuals
- X-mR
- Table X-mR
- Tabke X
- X
- mR
- z-mR
- Levey-Jennings
- Run
- Non-Normal X-mR
- Non-Normal X
Between/With
- X-mR-R
- X-mR-s
Time Weighted
- Moving Average/Moving Range
- CUSUM
- EWMA
Multivariate
- T2
Attributes
- p
- Laney p
- np
- u
- Laney u
- g
SPC for Excel is more than just control charts. Over the years, we have added many additional tools making our software a great tool for anyone who wants to improve their data analysis.