Tukey’s Method for Means Help
Home » SPC for Excel Help » Statistical Tools » Multiple Processes Help » Tukey’s Method for Means Help
Tukey’s Method is used to compare means from multiple processes. The method compares all pairs of means. It controls the family error rate (α). Both the family error and the individual error rates are given in the output. The output from this method also includes the ANOVA table, the table of mean comparisons, and a graph containing all pairs of means.

There are two options for entering the data: stacked or unstacked. Stacked data have each treatment in a single column. Unstacked data have the treatment labels in one column and the results in the adjacent column. The example below uses unstacked data.
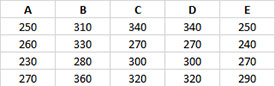
Five different treatments (A to E) were used to control the weight of a coating in grams. There were four samples for each treatment. We want to use Tukey’s method to determine if there are any significant differences in the treatments.
- 1. Enter the data as shown below. The column headings represent the treatment labels with the responses for each treatment under the label. The number of results for each treatment do not have to be equal. The data can be downloaded at this link.
- 2. Select the data and the column headings.
- 3. Select “Multiple Processes” from the “Statistical Tools” panel in the SPC for Excel ribbon.
- 4. Select the “Tukey’s Method for Means” option. Select OK and the input form below is displayed.
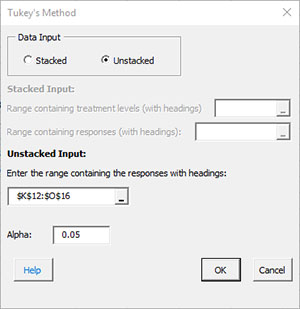
- Data Input: there are two options: stacked and unstacked. If the range selected on the worksheet contains more than two columns, the default is unstacked; this can be changed. For more information on stacked versus unstacked data, click here.
- Stacked Option: these are the ranges to be entered:
- Range containing the treatment levels.
- Range containing the responses.
- Unstacked Option:
- The data must be columns with the first cell in each column representing the treatment level.
- Alpha: this is the confidence level; 1-alpha is the confidence interval; default is 0.05 for 95% confidence.
- Select OK to generate the results.
- Select Cancel to end the program.
Tukey’s Method for Means Output
There are two new worksheets added for to your workbook for this test. One worksheet contains the numerical results. The other worksheet contains the confidence interval plots for each pair of treatments. The output is described below starting with the numerical results.
Numerical Results
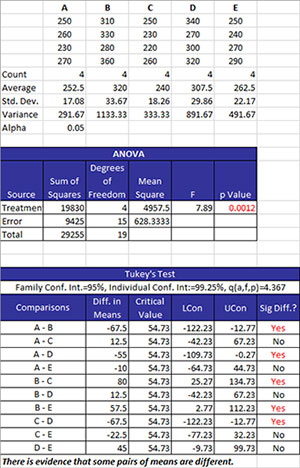
The data are summarized as stacked data along with some statistics for each treatment level. The statistics include the number of results (count), the average, the standard deviation, and the variance for each treatment level. The value of alpha is also given.
The ANOVA table is given next. This table provides the sum of squares of the treatments, error and total as well as the degrees of freedom. The mean square results are given along with the F value. The key number is the p value. If this is less than or equal to alpha, it is turned red. This means that there is significant difference in the treatment means.
The table of means is then given. The family error rate and the individual rate are given. These are expressed as confidence limits.
The columns in the table are:
- Comparisons: all possible combination of pairs of means.
- Diff in Means: the difference in the two means.
- Critical Value:
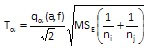
where qα(a,f) = the studentized range statistic, f = degrees of freedom associated with MSE, a = number of treatment levels, MSE = the mean square error, and n = the sample size for the individual treatment levels.
- LCon: the 100(1-α)% lower confidence interval = difference in means – Tα.
- UCon: the 100(1-α)% upper confidence interval = difference in means + Tα.
- Sig Diff?: if there is a significant difference, Yes is printed and turned to red; otherwise, No is printed. There is a significant difference if the absolute value of the difference in means is greater than the critical value.
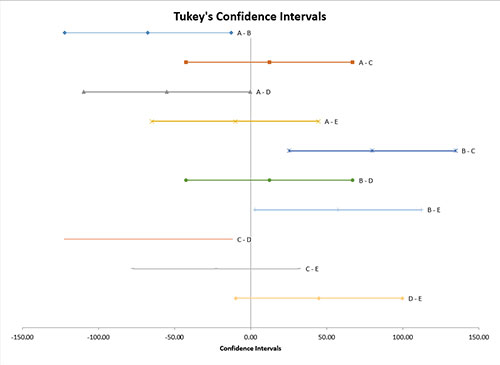
Confidence Interval Chart
This chart plots each pair of treatment levels. Those that do not include 0 are significantly different.