SPC for Excel Software
SPC for Excel Software simplifies statistical charting and analysis.
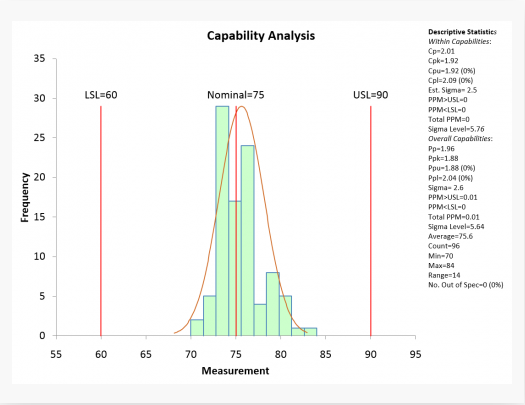
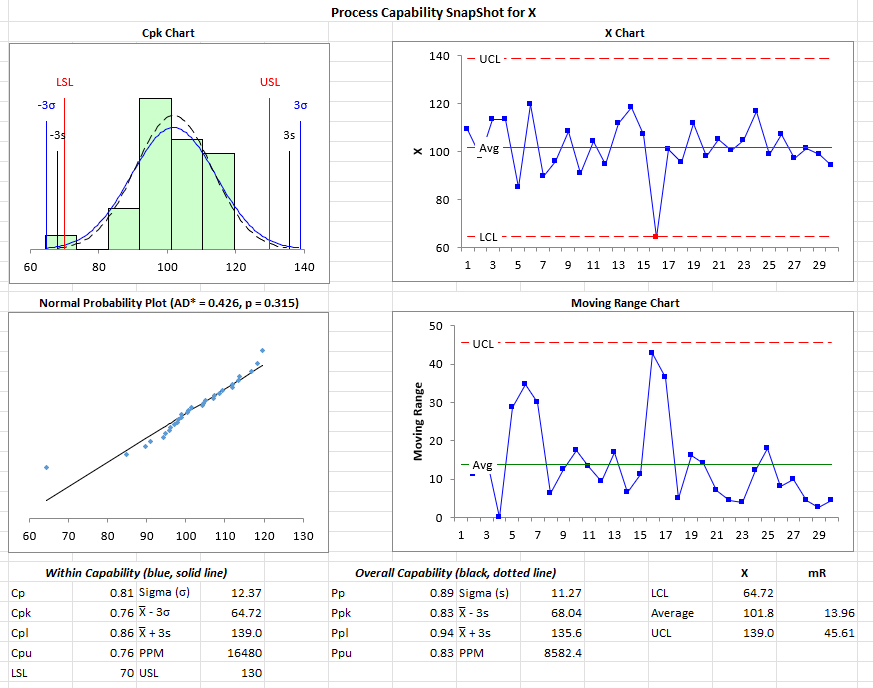
- Process Capability analysis - to meet your customer needs
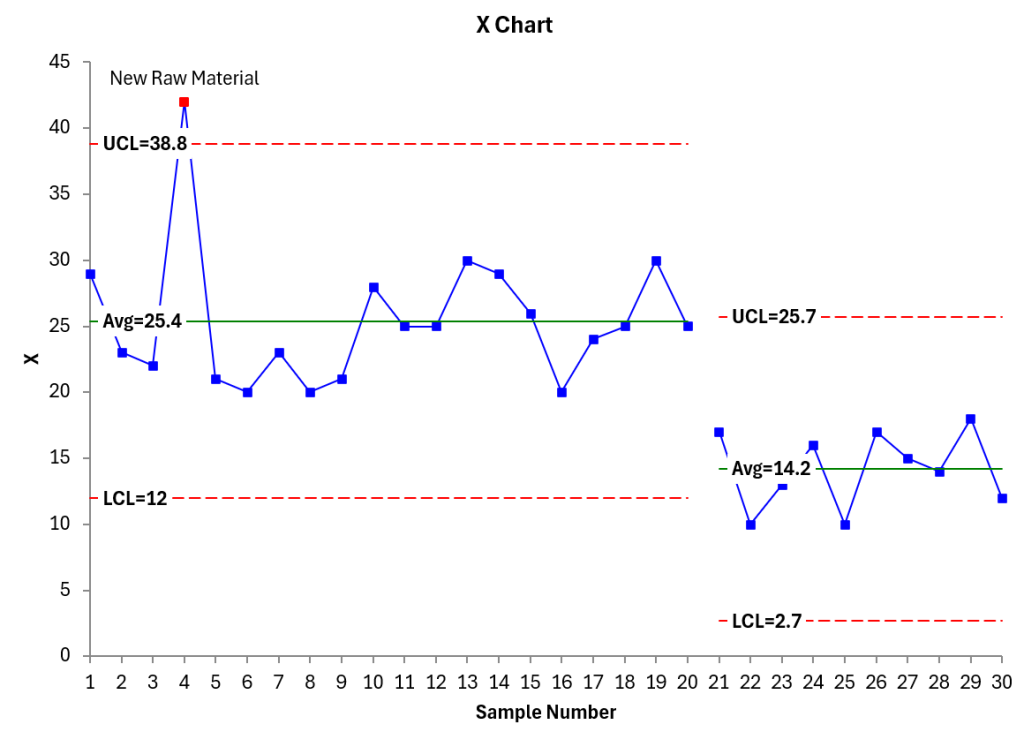
- Control Charts and Histograms - to manage your processes
- Gage R&R Study – to validate your measurement system
- Problem Solving Tools (Pareto, histogram, scatter, and more) - to help your team solve problems
- Advanced Data Analysis Tools (DOE, ANOVA, distribution fitting, regression, hypotheses testing, and more) – to meet your advanced needs
The perfect tool for statistical analysis and process improvement. See how easy it is to perform statistical charting and analysis in the familiar environment of Excel. SPC is helping companies and organizations worldwide improve processes by listening to their data.
- Simple, Affordable yet Powerful!
- Quick learning curve with Getting Started Guide, how-to videos, example data files and on-line help
- Runs in the familiar Excel environment
- Contains 100% of the statistical analysis tools that 95% of the people need
- Costs a fraction of major statistical software packages
- Free technical support, free builds for the current version, and no maintenance fees
- Install on your desktop computer and laptop
Would you believe it that today is the day that we go for our ISO 9000:2001 certification audit and the process capability charts I generated using your program actually saved the day for me?
Akbar Md. ThayoobPhu My Plastics & Chemicals Co., Vietnam
SPC for Excel is an exceptional tool for the presentation and analysis of data. This valuable tool is quick, easy and intuitive for the statistical beginner to the most advanced user.
Walt WilsonCertified Six Sigma Black Belt
I like the SPC software – thanks for making this program for excel. It filled a need I had for a statistics tool that I was familiar with having run six sigma projects for years but now just require the tools occasionally.
Maureen M
As a Six Sigma Black Belt I have used this great tool to support the completion of numerous projects. It is versatile as well as highly capable. This version has phenomenal enhancements that will make stronger analytical tools available to anyone with Excel. Way to go, SPC for Excel.
Walt WilsonCertified Six Sigma Black Belt
I recently purchased BPI Gage R&R and am extraordinarily pleased with it. I have been tasked with resuscitating our MSA program here and had thought that our gage management software's GR&R feature would do the trick.
Kevin WoolseyQuality Supervisor
Start your free trial now to see why professionals world-wide have chosen SPC for Excel!
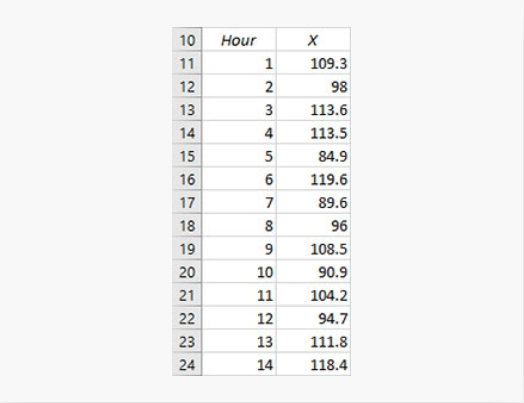
1) Enter your Data
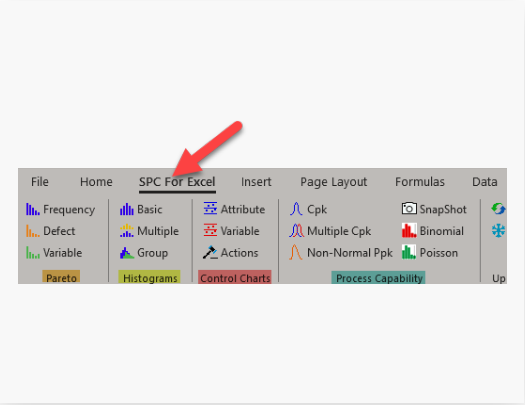
2) Select your option from the SPC for Excel ribbon
