Scatter Diagrams
Home » Scatter Diagrams
Need a scatter diagram to show a relationship between two variables:
- Overtime and amount of work
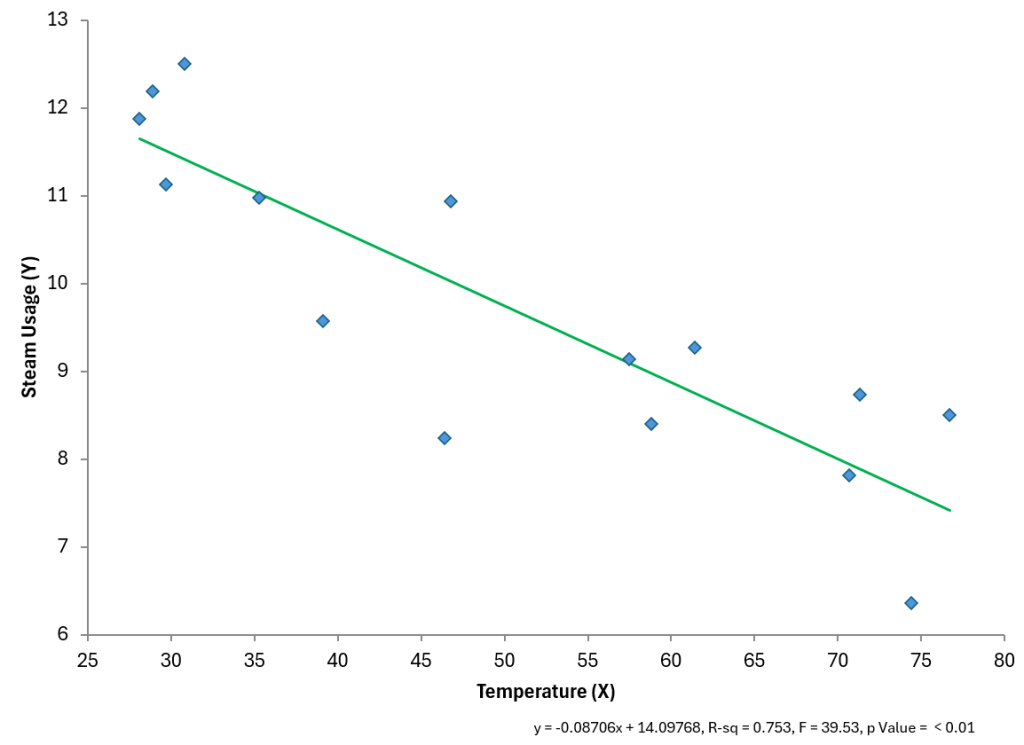
- Temperature and steam usage in a plant
- Speed and miles per gallon
- Density and purity of a product
Watch a Quick Video Highlighting Scatter Diagrams in SPC for Excel
Join the 100,000+ who are using SPC for Excel to understand their cause and effect relationships.
Scatter Diagrams and SPC for Excel
Our SPC software, SPC for Excel, easily creates scatter diagrams. A scatter diagram gives a visual picture of the relationship between two variables. One variable is plotted on the x axis and one on the y axis. The paired results can show a positive correlation, a negative correlation or no correlation. The p value for the best fit line helps determine if the correlation is significant.
Scatter Diagram Features
- Include best fit line
- Add labels to each point
- Update easily when new data is entered
- Add dates of data collection