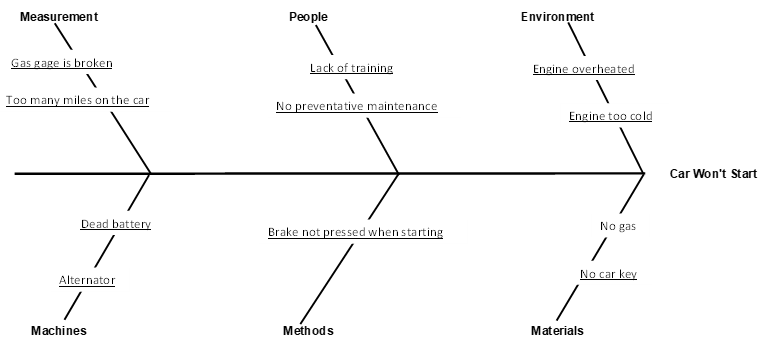
Our previous blog, What is a Cause and Effect Diagram, introduced the technique and presented the cause and effect diagram below on why a car will not start.
This blog addresses how you analyze a cause and effect diagram. The first step is to examine each idea and determine the degree to which the idea is an actual cause of the problem. For example, how likely is no gas to be the reason the car won’t start. Is it very likely? Is it somewhat likely? Or is it not likely?
How is this done? In general, you hold a quick discussion with the folks who developed the cause and effect diagram (hopefully that includes those closest to the process) and a general decision is reached on ranking each idea as:
- Very likely (V)
- Somewhat likely (S)
- Not likely (N)
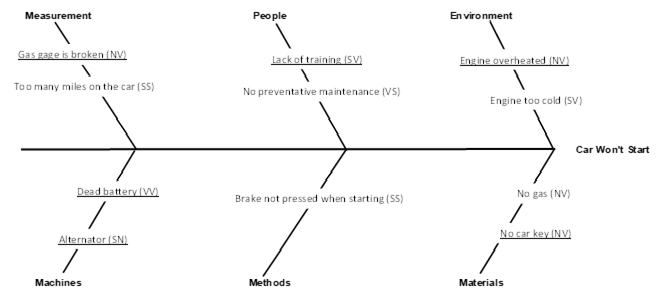
The corresponding letter (V, S or N) is noted beside that cause on the cause and effect diagram. For example, how likely is “engine overheated” likely to the cause of the problem? If the car has been sitting awhile, it is “Not Likely” and an “N” is placed by that cause as show in the figure below.
The next step is to determine how easy is it to check or verify the cause. That is, how easy is it to determine no gas is the cause of the car not starting. Is it very easy? Is it somewhat easy? Or is it not easy? For each item on the cause and effect, determine how easy it is to verify that item is the cause of the problem using the following rating scale:
- Very easy (V)
- Somewhat easy (S)
- Not easy (N)
The corresponding letter (V, S or N) is noted beside that cause’s likelihood on the cause and effect diagram. For example, for the “engine overheated” cause, it is easy to very. So a “V” is added to that cause. This is shown below.
The causes that receive VV responses are investigated first since these are most likely to be the cause of the problem and are the easiest to check. In this example, dead battery appears to be the most likely reason that the car won’t start.
Our SPC for Excel software allows you to create cause and effect diagrams in Excel.


