Measurements tell us many things. They tell us if a product is within specification, if we met our goal, if we are staying the same, if we are improving, if we are getting worse, etc. What makes a good measurement process? This is essentially asking the following question:
What does it take for us to trust our measurement process?
Think about trust. Why do we trust some people? One reason is that they are consistent – we know what to expect from them because they are consistent. The same is true of our measurement processes. We begin to trust them once we know we are getting consistent results over time.
So how can we trust our measurement system? It is really very easy to do. All you do is run a standard or control on a regular basis and plot the results using an individuals control chart (X-mR). A standard is something that you know the value of. A control is something that you don’t know the “true” value of but will use over time to monitor the consistency of the measurement process. The key is that you measure the same item multiple times.
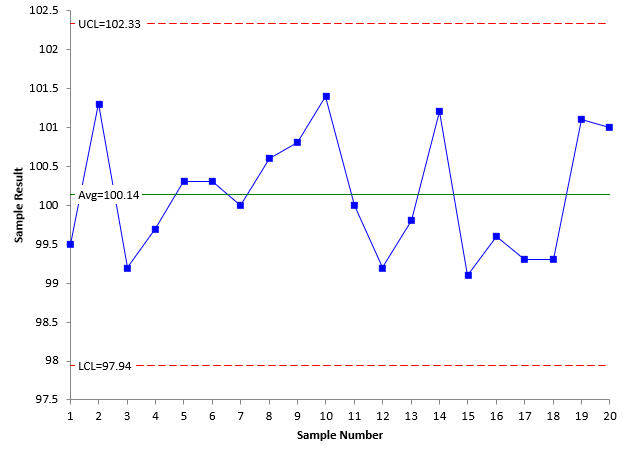
For example, suppose you have measured an item 20 times. You take the 20 measurement results and plot them on an individuals control chart (X-mR). The X control chart is shown below.
The X control chart monitors the individual results over time. The purpose of the X control chart is to determine if the individual results are consistent over time. If there are no out of control points (no points beyond the control limits or patterns like a run above the average), the measurement process is in statistical control with respect to the average. It is consistent.
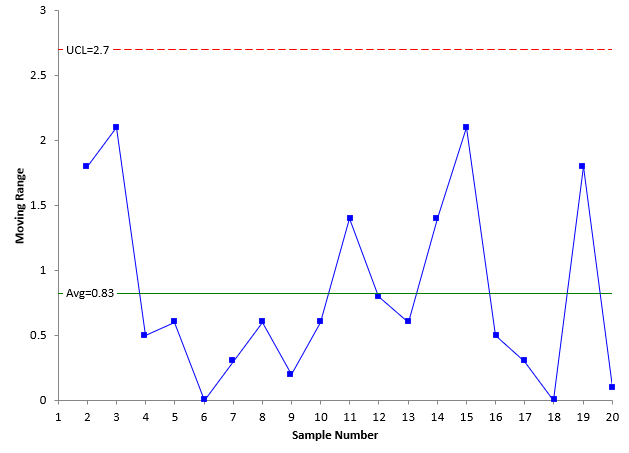
The moving range chart is shown below.
The moving range chart plots the moving range between consecutive results. This chart examines whether the short-term variation (range between consecutive results) is consistent over time. The moving range chart is in statistical control. It is consistent.
If there had been any out of control points, you would need to find the reason for the out of control point and eliminate it. The measurement process is not consistent when there are special causes of variation present.
Once the measurement process is consistent, you lock the control limits and extend them into the future. You continue to measure the standard/control regularly and plot the results on the X-mR chart.
This allows you to monitor the measurement process over time for consistency – and trust the measurement results you are getting.

