Control Charts in Excel
Home » SPC for Excel Software » Control Charts in Excel
Create Professional Control Charts in Excel — Automatically
Stop manually calculating control limits or building fragile spreadsheet templates. SPC for Excel lets you create accurate, presentation-ready control charts directly inside Excel — in minutes.
With SPC for Excel you can:
- Automatically calculate control limts
- Update charts automatically as new data is added
- Detect out-of-control conditions using built-in rule checks
- Lock limits to track process improvements over time
- Generate clean, professional charts ready for reporting
Full featured trial. No credit card required.
Why Accurate Control Charts Matter
Control charts are the foundation of statistical process control. When limits are calculated incorrectly or rule violations are missed, teams may react to normal variation — or overlook real process shifts.
Many organizations attempt to create control charts manually in Excel. While possible, manual methods often require:
-
Multiple formulas and careful range management
-
Separate calculations for control limits
-
Manual checks for rule violations
-
Rebuilding charts when data is updated
Even small spreadsheet errors can affect conclusions and decision-making.
SPC for Excel automates these calculations and applies consistent statistical methods — helping ensure control charts are created correctly every time.
See How Control Charts Are Created in Excel
The short demonstration here shows how quickly professional control charts can be created using SPC for Excel.
SPC for Excel allows you to:
- Add data to easily update control charts
- Apply rule checks automatically
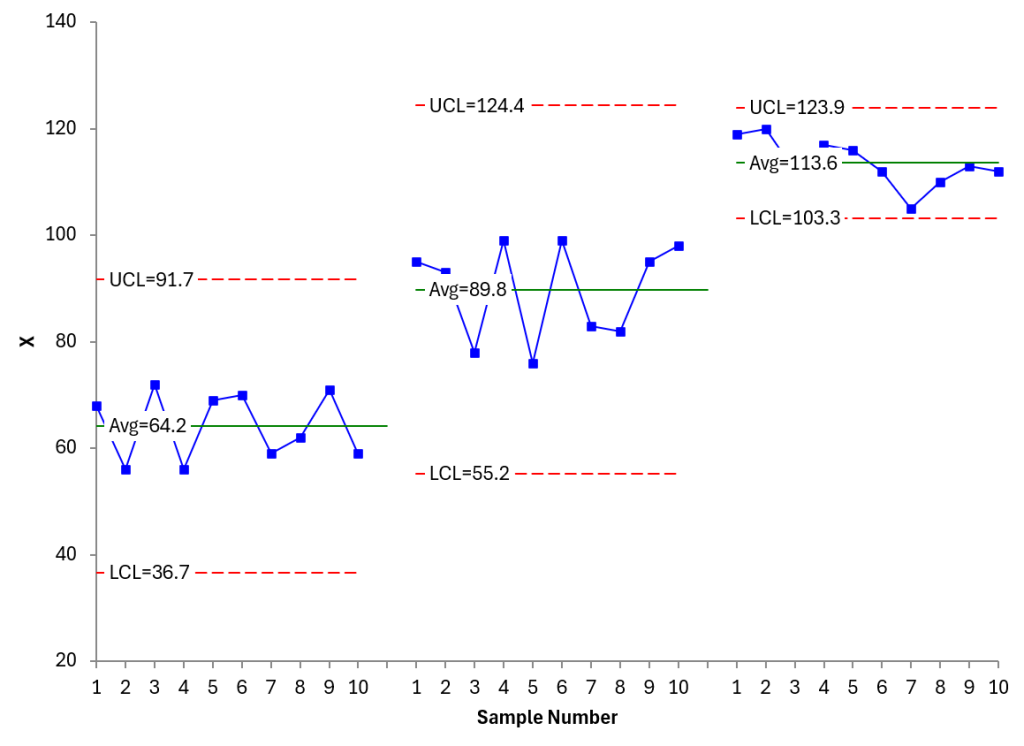
- Split the control limits to show process improvements
- Lock the control limits in place for future data
- Export charts for presentations and reports
Control Chart Types Included in SPC for Excel
SPC for Excel includes more than 25 control chart types designed for real-world process monitoring.
Variable Control Charts
Used for continuous measurement data
- X-R
- X-s
- X
- R
- s
- Median-R
- Median
These charts monitor process averages and variation within rational subgroups
Attribute Control Charts
Used for defect counts and proportion-based data
- p
- Laney p
- np
- c
- u
- Laney u
- g
These charts are ideal for monitoring defect rates, nonconformances, and count-based processes
Multivariate Control Charts
- T2
Used when monitoring multiple related variables simultaneously
Individuals Charts
Used when data is collected one observation at a time
- X-mR
- Table X-mR
- Tabke X
- X
- mR
- z-mR
- Levey-Jennings
- Run
- Non-Normal X-mR
- Non-Normal X
Individuals charts are commonly used in service industries, healthcare, and low-volume production environments
Time-Weighted Charts
Designed to detect smaller process shifts more quickly than traditional Shewhart charts.
- Moving Average/Moving Range
- CUSUM
- EWMA
Time-weighted methods are useful when early detection of subtle variation is critical
Between/Within Control Charts
- X-mR-R
- X-mR-s
Used to separate between-subgroup and within-subgroup variation
Trusted by Quality Professionals Worldwide
“Love that there are a full range of control charts in there – and it is simple to use. This was the reason I wanted our organization to purchase your product – cost effective, useful and easy to use. I also love the website which is full of useful information especially relating to when and how to use a control chart – and you include examples from healthcare! This is often so hard to find – and healthcare is such a different industry than say, manufacturing, sometimes it is hard to see where a control chart may assist in quality improvement and monitoring.”
-Sara M.
There are many more options to use with control charts in SPC for Excel, but SPC for Excel is more than just control charts. Over the years, we have added many additional tools making our software a great tool for anyone who wants to improve their data analysis. Explore all the other statistical tools in SPC for Excel below.