January 2026
 It is January 26, 2026. The USA just had a huge winter storm that laid inches of ice and snow through a large path across the states. There were 10 inches where I live – and now it is bitter cold. Single digit cold mornings. Not getting above freezing for several days. So, a good topic for this month’s publication is ……. global warming! Let’s get started.
In January 2026, NASA released the following:
“Earth’s global surface temperature in 2025 was slightly warmer than 2023 – but within the margin of error: the two years are effectively tied according to an analysis by NASA scientists. Since record-keeping began in 1880, the hottest year on record remains 2024.
Global temperatures in 2025 were cooler than 2024, with average temperatures of 2.14 degrees Fahrenheit (1.19 degrees Celsius) above the 1951 to 1980 average.”
You don’t really get a feel for what is happening over time from this small release. Yes, we all know that the earth’s temperature is increasing over time. We don’t necessarily agree on what is causing it.
We have been looking at the changes in global temperatures on a yearly basis since 2015 using run and control charts to get a more in-depth look at how the global temperature is changing. In this publication, we update the previous publications by adding the 2025 results. What does the data now tell us with the 2005 global temperature being added?
We focus our analysis on the data from 1987 on, when the upward trend in global temperature began. We analyze the temperature data using two approaches. One analysis is done using a trend control chart to monitor the global temperatures. The other analysis is using a series of step changes, with each step change being in statistical control.
In this publication:
- Global Temperature Data
- Global Temperature Viewed as a Trend Control Chart
- Global Temperature Viewed as Step Changes Over Time
- Summary
- Quick Links
Please feel free to leave a comment at the end of this publication or download a pdf file of this publication at this link.
Global Temperature Data
The global temperature data used in this publication is taken from the National Aeronautics and Space Administration (NASA), in particular the Goddard Institute for Space Studies. You can access the data used in this publication at this link. You want to download the data that is labelled “Global-mean monthly, seasonal, and annual means, 1880-present, updated through most recent month.”
The data are not given as absolute temperatures. Instead, the data are given as deviations from a baseline period. The baseline period used was from 1951 to 1980. The temperature during this baseline period was stable, as we showed in an earlier publication: SPC and Global Warming: 1880 – 2021.
The data are reported monthly. The average deviation for a year is then calculated. The deviations are given in degrees Celius. Table 1 shows the monthly global temperature deviations for 2025.
Table 1: 2025 Monthly Global Temperature Deviations
|
Month |
Deviation |
Month |
Deviation |
|
|
Jan-25 |
1.38 |
Jul-25 |
1.02 |
|
|
Feb-25 |
1.26 |
Aug-25 |
1.16 |
|
|
Mar-25 |
1.36 |
Sep-25 |
1.25 |
|
|
Apr-25 |
1.23 |
Oct-25 |
1.19 |
|
|
May-25 |
1.08 |
Nov-25 |
1.21 |
|
|
Jun-25 |
1.05 |
Dec-25 |
1.05 |
For example, the temperature deviation for January 2025 was 1.38°C above the baseline data from 1950 – 1981. The 2025 average global temperature deviation is simply the average for the 12 months. That value is 1.05. So, for 2025, the annual global temperature deviation was 1.05 above the baseline data.
Figure 1 is a run chart for the annual global temperature deviations from 1880 – 2025. The average is included – although it really doesn’t mean anything at this point. All charts in this publication were made with the SPC for Excel software.
Figure 1: Annual Global Temperature Deviations (1880 – 2025)
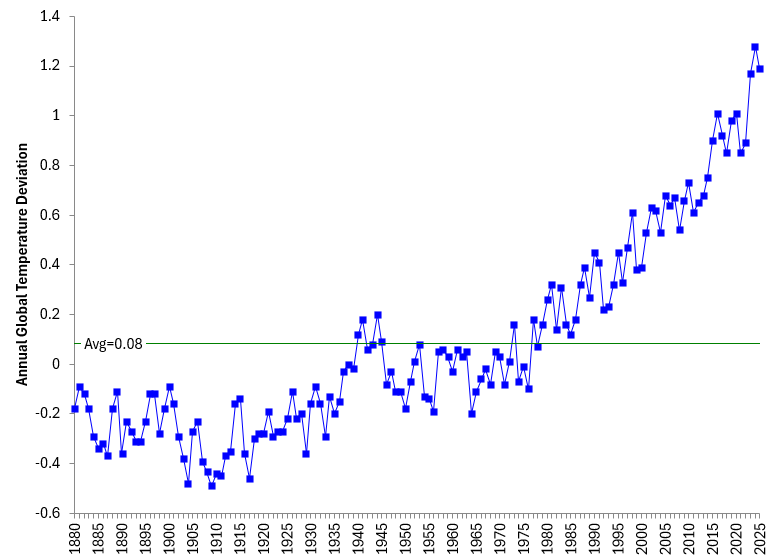
It is easy to see when the upward trend started back around 1987 or so. And it is also easy to see that the last three years have had a big step upward – and they are the hottest three years since 1880. 2024 is the hottest year on record since 1880 with a 1.28 deviation; this past year, 2025, is the second hottest on record since 1880, with a 1.19 deviation.
The run chart, while a good visual, does not really tell us much about the stability of the process. To do that, we will look at the data from two perspectives: as a trend control chart and as a series of step changes over time.
In previous publications on global warming, we have presented the calculations behind the control charts and trend control charts. We will not go into detail again about the calculations, but we will reference the articles where you can get more information on the calculations if you want to.
We will start with the trend control chart.
Global Temperature Viewed as a Trend Control Chart
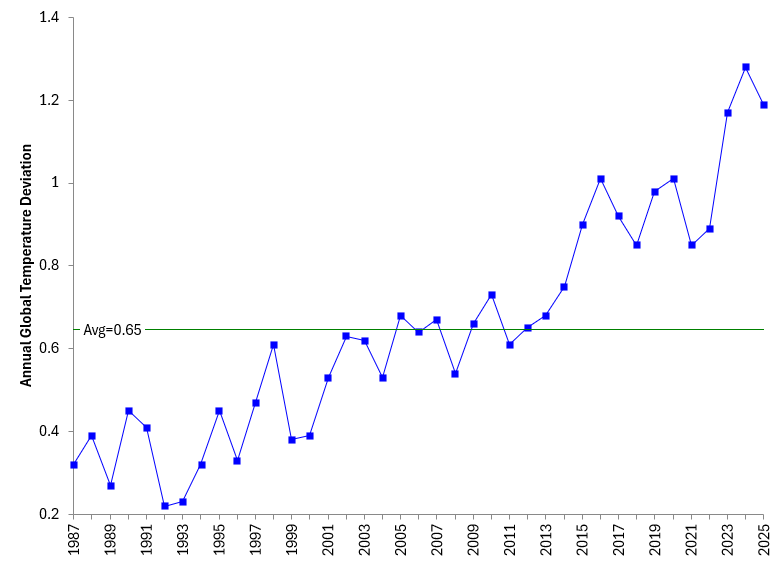
It is clear in Figure 1 that there is an upward trend in the data that starts about 1987. Figure 2 is a run chart of the temperature data since 1987.
Figure 2: Annual Global Temperature Deviations (1987 – 2025)
Constructing a classical control chart with this data won’t tell you much since there is a clear trend upward. If you want to see what a classical individual (X-mR) control chart would look like with this data, please see our SPC Knowledge Base article SPC and Global Warming: 1880 – 2024. This is last year’s publication that provides an update through 2024 data.
To make use of data that trends up or down on a chart, you need to use a trend control chart. This is similar to the classical X-mR control chart except that the center line is the best fit regression line for the trend. This is explained in detail in the article reference above for the 1880 – 2024 data.
The trend control chart is shown below in Figure 3. We will just show the X trend control chart here and not the moving range chart.
Figure 3: Trend Control Chart for Annual Global Temperature Deviation (1987 – 2025)
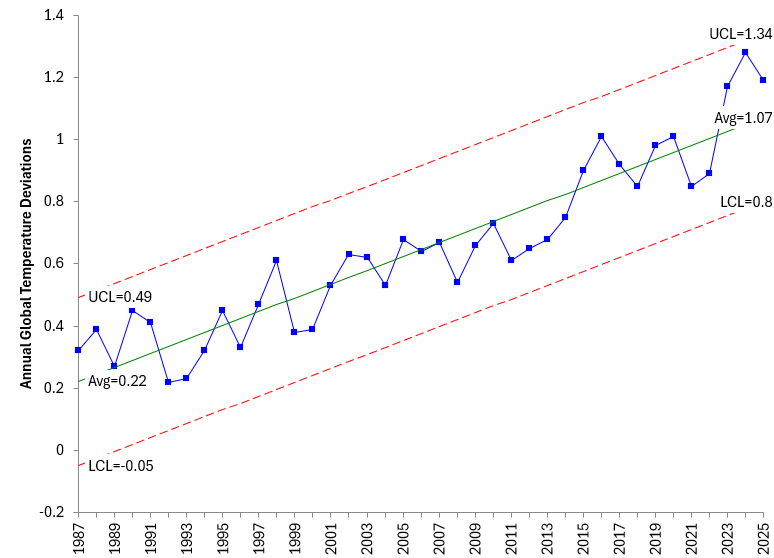
The trend chart in Figure 3 is in statistical control. No points beyond the control limits .
We conclude that the annual global temperature deviation will continue to increase in the near future. There is no indication that this will change anytime soon.
The best-fit line for the temperature data since 1987 is:
Annual Global Temperature Deviation = -44.1069 + (0.0223)Year
The slope of the best fit line gives the average change per year in the annual global temperature deviation. The slope is 0.0223, which means that on average the annual global temperature is increasing 0.0223 °C per year.
Global Temperature Viewed as Step Changes Over Time
There is a challenge when examining data that is trending upward or downward. Is there an actual trend (like indicated above) or can the trend be explained by a series of step changes in the data? We have examined this over the past few years in our previous publications on global warming.
Essentially what you do is examine the data and look for periods of stability. This has been done for the data since 1987 and is shown in Figure 4.
Figure 4: Annual Global Temperature Deviation as a Series of Step Changes

Figure 4 shows that there have been four periods of stability since 1987. These start in the years 1987, 2002, 2015 and 2023. The last three years have had an average of 1.21 with a UCL of 1.48 and lower control limit of 0.95. But there are only three points.
It is interesting that the periods of stability between a step change up are getting shorter (fewer years). The rate of change is increasing from 0.38 for the first period of stability, to 0.64 for the next to 0.93 and 1.21 for the last period. The last three years represent the start of a new period of stability.
Based on this control chart, one would expect the annual global temperature deviation to form a stable pattern for several years, before the next step change upward. There is nothing to indicate that global warming is slowing down. It these are true step changes, what is causing them?
Summary
This publication has continued our look at global warming using the annual global temperature deviation. The data covers the period from 1880 – 2025 with an emphasis on the data from when the upward trend started (1987). There was no attempt to explain the reason for the increase during this time period – just to analyze the data.
The data were examined from two perspectives: as a trend control chart and as a series of step changes on a control chart. Global warming is not slowing down.