Control Chart Options
Home » Control Chart Options
Our SPC for Excel software has many options and actions supporting the 25+ control charts. No matter if you need a quick and simple control chart or an elaborate analysis, the control charts in SPC for Excel have you covered. See how easy it is to make charts, add and update, choose options and actions in the familiar environment of Excel.
All of These Quick yet Powerful Options/Actions:
Control Charts
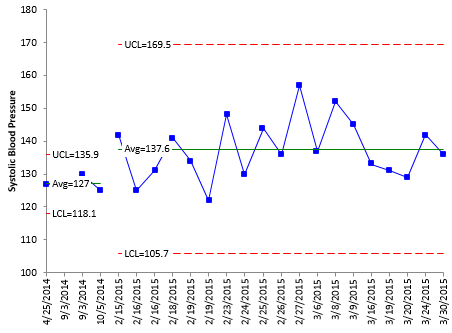
- Easily update charts with new data
- Split control limits
- Remove a point from the calculations
- Add comments to a point
- Delete all points beyond the control limits from the calculations
- Handles varying subgroup sizes
- Add target
- Option to check for trends
- Show last k data points
- Don't allow values less than 0
- Add dates of data collection
- Maintains format changes when chart is updated with new data
- Move chart anyplace within the workbook
Out of Control Tests
- Select which tests to use
- Points beyond the control limits, zone tests, trend up or down, mixture, stratification, overcontrol
- Select number of points required for an out of control signal
- Save options for future charts
- Out of control points in red
- Option to plot 1 and 2 sigma lines
- Option to label out of control points with reason for being out of control
Average and Control Limits
- Option to change the +/- 3 sigma limits to another value
- Option to estimate sigma from R, s, or pooled variance for subgroup averages chart
- Manually add average and sigma to use in calculations
- Manually add control limits
- Lock the average and control limits
- Print average and limits on chart or in title
- Control rounding of average and limits on chart
- Select range to base control limits on
- With individuals charts, the option to use the median instead of the average (for moving range as well)
- With the individuals chart, the option to add the specifications to the chart
Data Transformation
- Perform Box-Cox transformation on data
Process Capability
- Link process capability analysis to the control chart