Process Capability (Cpk) Improvement Seminar
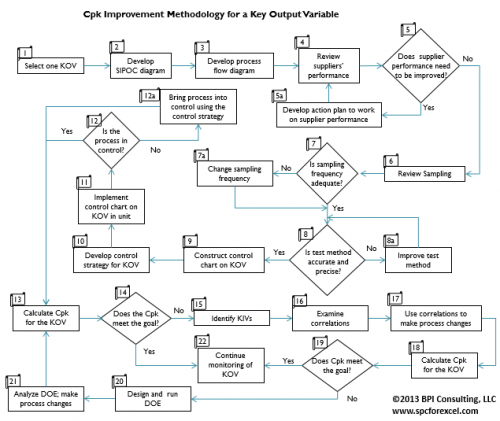
The purpose of the Process Capability Improvement Seminar is to lay out a methodology for continual process improvement using the Cpk metric to judge improvement. The methodology is outlined below. Each attendee brings data related to a product including supplier and measurement systems data. In addition, during the seminar, each attendee develops an implementation plan for when he/she returns to work.

- Key Output Variable (KOV) is selected – a specification that is important to a customer - it can be, for example, weight, size, purity, density, or on-time delivery – something that is critical to the customer.
- A SIPOC diagram is constructed to show the relationship between the suppliers - inputs - process - outputs - customers.
- A process flow diagram for the KOV is developed.
- Supplier performance is reviewed using histograms and control charts.
- Sample frequency is reviewed.
- The accuracy and precision of the measurement system is determined - answers the question - is the measurement system any good?
- The KOV is analyzed using histograms and control charts.
- A control strategy is developed for operators to use to keep the KOV in statistical control.
- The process capability is calculated.
- If it meets the goal, then the KOV is continually monitored.
- If it does not meet goal, then the key input variables (KIV) are defined using cause and effect diagrams and advanced techniques such as correlation, regression and experimental design are used to determine which KIV impact the KOV.
- Process changes are made and the process capability (Cpk) is calculated again.
- The methodology continues until the goal for Cpk is reached – or you determine that you just can’t do it with the current process.

The process flow diagram of the methodology is shown below.
Statistical methods covered during the Process Capability (Cpk) Improvement seminar include:
- Variation
- Individuals Control Charts
- Process Flow Diagrams
- Types of Data
- Pareto Diagrams
- Histograms
- Interpretation of Control Charts
- p and np Control Charts
- c and u Control Charts
- X-R Control Charts
- X-s Control Charts
- Individuals Control Charts
- Control Strategies
- Process Capability
- Measurement Systems Analysis/Gage R&R
- Scatter Diagrams/Correlation/Regression
- Experimental Design Introduction