Equivalence of Instruments
Home » SPC for Excel Help » Analysis Help » Measurement Systems Analysis Help » Equivalence of Instruments
This procedure is used to determine if measurement instruments are equivalent in terms of bias and measurement error. One operator measures the same part multiple times on each instrument. This procedure requires that the part is run the same number of times on each instrument. The output includes a worksheet containing the consistency chart for each instrument, the ANOM chart for instrument bias and the Analysis of Mean Moving Ranges chart for measurement error. The data used below can be downloaded at this link.
This procedure is based on two articles written by Dr. Donald Wheeler and Dr. James Beagle III, When are Instruments Equivalent, Part 1 and Part 2, published at www.qualitydigest.com.

- 1. Enter the data in an Excel spreadsheet. The name of the instrument must be in the first cells and the results for that instrument underneath the name. The instruments must be in adjacent columns. The first column is the sample identifiers.
| Sample | A | B | C |
|---|---|---|---|
| 1 | 215 | 213 | 220 |
| 2 | 217 | 210 | 211 |
| 3 | 216 | 220 | 217 |
| 4 | 214 | 211 | 210 |
| 5 | 213 | 217 | 213 |
| 6 | 218 | 216 | 217 |
| 7 | 214 | 216 | 212 |
| 8 | 217 | 212 | 214 |
| 9 | 222 | 215 | 212 |
| 10 | 216 | 215 | 214 |
| 11 | 219 | 219 | 209 |
| 12 | 210 | 209 | 214 |
| 13 | 218 | 212 | 218 |
| 14 | 214 | 217 | 213 |
| 15 | 211 | 216 | 212 |
| 16 | 214 | 223 | 210 |
| 17 | 218 | 219 | 211 |
| 18 | 216 | 214 | 212 |
| 19 | 218 | 212 | 216 |
| 20 | 216 | 214 | 213 |
| 21 | 211 | 216 | 219 |
| 22 | 222 | 217 | 210 |
| 23 | 214 | 215 | 210 |
| 24 | 211 | 221 | 213 |
| 25 | 211 | 220 | 210 |
| 26 | 217 | 220 | 208 |
| 27 | 222 | 220 | 218 |
| 28 | 219 | 211 | 212 |
| 29 | 216 | 212 | 210 |
| 30 | 208 | 214 | 212 |
- 2. Select the headings and the data.
- 3. To start the analysis, select “MSA” from the “Analysis” panel on the SPC for Excel ribbon. Then select “Equivalency of Instruments”. The input form below is shown.
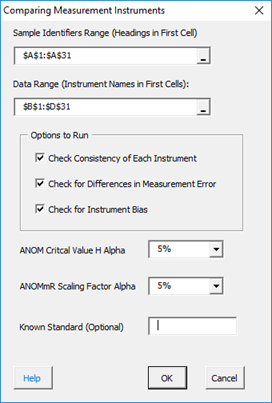
- Sample Identifiers Range: the range on the worksheet containing the sample identifiers, must be a heading in the first cell of the range, if the range is not correct, it can be edited in the form.
- Data Range: the range on the worksheet containing the instrument data; the name of the instrument must in the first cell; if range is not correct, it can be corrected, it can be edited in the form.
- Options to Run: there are three
- Check Consistency of Each Instrument: this makes a consistency chart for each instrument; it is recommended you run this option first.
- Check for Differences in Measurement Error: this uses ANOMmR to see if there are differences in measurement error between the instrument.
- Check for Instrument Bias: this using ANOM to check for differences in bias between the instruments.
- ANOM Critical Value H: select the alpha for the value of H, the default is 5%.
- ANOMmR Scaling Factor: select the alpha for the scaling factor for ANOMmR, the default is 5%.
- Known Standard (Optional): enter the known standard if used in the analysis.
- 4. Select OK and the output is generated based on the options selected in the form above.
Output – Consistency Charts
It is recommended you run the three options above one at-a-time. You would start with only “Check Consistency of Each Instrument” checked. This generates a consistency chart for each instrument as well as a summary of the results. If an instrument’s consistency chart is not in statistical control, you should not use that instrument in the rest of the analysis. The summary and consistency chart for instrument A is shown below.
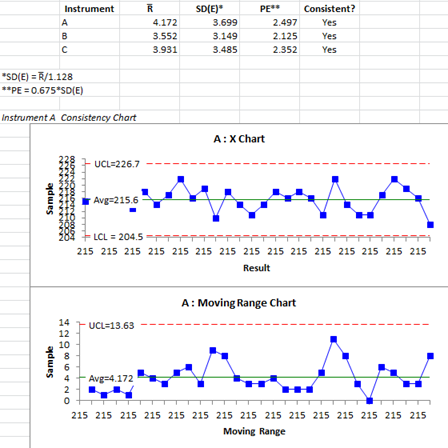
The summary gives each instrument’s average moving range, standard deviation, probable error and if it is consistent are not.
Output – Comparing Instrument Measurement Error
Using only the instruments that are consistent, run the second option above: Check for Differences in Measurement Error. This tells you if any instruments have a measurement error that is significantly different from the others. The analysis uses the ANOMmR technique described in the reference above.
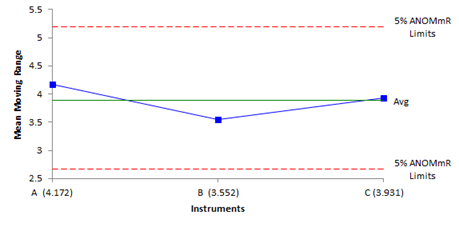
The output provides an interpretation of the results. Only use the instruments whose measurement error is in control for the bias analysis. The calculations used are also given.
Output – Comparing Instrument Bias
Using only the instruments whose measurement system is in control, run the third option below: Check for Instrument Bias, This tells you if any instruments have a bias that is significantly different from the others. The analysis uses the ANOM technique described in the reference above.
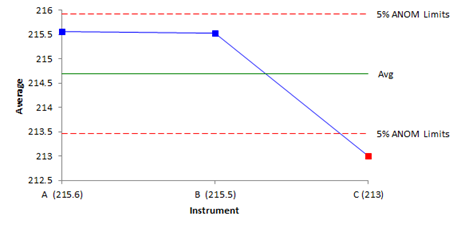
If there is an instrument beyond the detection limits (like instrument C above), the software will combine the instruments in control and adjust the average using just those points. The ANOM chart is then redrawn. If a known standard is included, the value of the standard will be used as the center line and the ANOM redrawn.
The software will also check to see if the bias is of practical importance. This occurs is the bias is greater than 1.128SD(E) where SD(E) is the measurement error.