Components of Variance (ANOVA)
Home » SPC for Excel Help » Analysis Help » ANOVA Help » ANOVA Output Help » Components of Variance (ANOVA)
If this option “Display Components of Variance and Expected Mean Squares” was selected from the output options, the program adds additional information to the ANOVA worksheet for the components of variance and the expected mean squares as well as a chart sheet that contains the components of variance graph.

The table below is from the example data for the ANOVA.
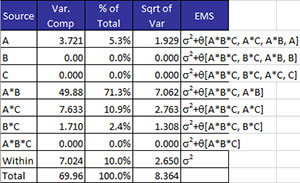
There are 5 columns:
- Source: source of variation
- Var. Component: variance of the source of variation. If the variance is below zero, the variance is set to zero.
- % of Total: % of total variance due to the source of variation
- Sqrt of Var: square root of the variance of the source of variation
- EMS: the expected mean square
- The expected means square is based on the algorithm in the book “Design of Experiments” by Virgil Anderson and Robert McLean.
- ?2 is used for random components.
- ? is used for fixed components and represents a non-negative function of the effects contained in the brackets.
- Any component containing a random factor is considered random. For example, C is the random factor above. The component A*C is considered random.
- The numbers in the expected mean square correspond to a source of variation; e.g., 1 corresponds to factor A, 2 to factor B and 3 to factor C in this example
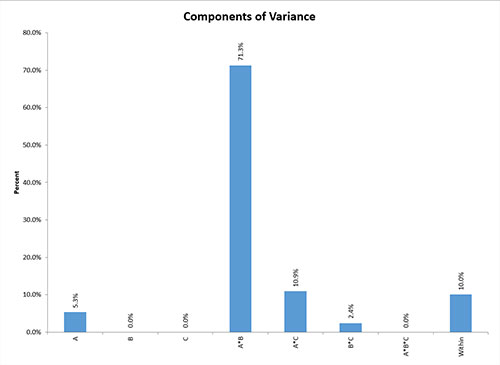
In addition to this table, a plot of the % of the Total against the source of variation is placed on a new chart sheet. The chart for this example is shown below. This allows you to easily see which components have the most variation. This is most useful for random factors.