ANOVA Worksheet Help
Home » SPC for Excel Help » Analysis Help » ANOVA Help » ANOVA Output Help » ANOVA Worksheet Help
There will always be a worksheet named ANOVA added to the worksheet. If there is already a worksheet named ANOVA, the program will add a number after ANOVA. The worksheet contains the ANOVA table, the ANOVA model and a few statistics. There may be additional output on this worksheet depending on the options selected.
The top part of the worksheet is shown below. The ANOVA table for the sources of variation is given along with the ANOVA for the model (contains all the sources).

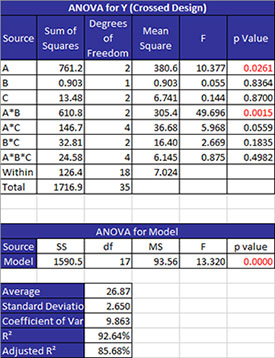
Any factors with a p value below 0.05 are considered to be significant. These will be in red. Any values above 0.20 are considered not to be significant. Factors with p values between 0.05 and 0.20 may or may not be significant.
There are a few statistics given as described below.
- Average: the average of all treatments
- Standard Deviation: the square root of the mean square error
- Coefficient of Variation: the error expressed as a % of the average, 100(Average/Standard Deviation)
- R Squared: measures the proportion of the total variability measured explained by the model; formula is 1 – (SSWithin/SSTotal)
- Adjusted R Squared: the value of adjusted for the size of the model (the number of factors in the model); formula is 1 – (MSError/(SSTotal/DFTotal)