Analysis of Individual Values (ANOX) Help
Home » SPC for Excel Help » Analysis Help » Analysis of Individual Values (ANOX) Help
The analysis of individual values is a test to determine if the data are homogeneous. For example, you might run this analysis to determine if you baseline data for a control chart is homogeneous. The analysis can handle up to 480 points and is based on the article “ANOX: The Analysis of Individual Values” by Donald J. Wheeler and James Beagle III published in Quality Digest.
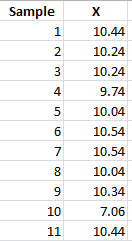
The example involves 48 senors simultaneously exposed to a current. The current through each senor was measured. The readings were tested for homogeneity at 10% alpha level. The data used can be downloaded at this link.

- 1. Enter the data as shown below. The sample numbers and X values must be in columns. Select the first cell in the sample column.
- 2. Select “ANOX” from the “Analysis” panel on the SPC for Excel ribbon. The input form below is shown.
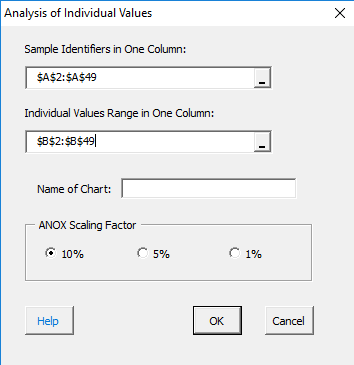
- Sample Identifiers in One Column: enter the range of the sample identifiers in the worksheet. The program attempts to select the ranges based on the selection in the worksheet. You can edit the range here if it is not correct.
- Individuals Value Ranges in One Column: enter the range of the individual values.
- Name of the Chart: enter the name of the chart; this must be a unique name in the workbook as it is used to update this chart.
- ANOVA Scaling Factor: select the alpha level for the ANOX scaling factor; options are 10, 5 and 1. 10 is the default.
- 3. The ANOX chart is then created as shown below.
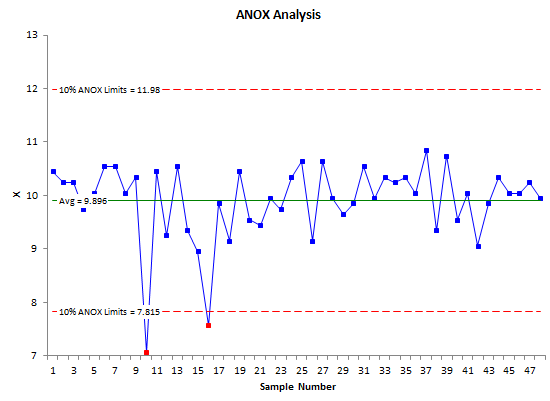
The center line is the average of the X values. The ANOX limits are determined the following:
Average +/- ANOXa(Averge Moving Range)
Any X values beyond the ANOX limits are in red.
You can update this chart or change the options for the chart by going to the Updating/Options panel on the SPC for Excel ribbon.