All Factors Residual Info Worksheet Help
This worksheet contains a table with the residual information. The output from this example is shown below. The columns are explained below. Cells that are in red represent potential outliers.

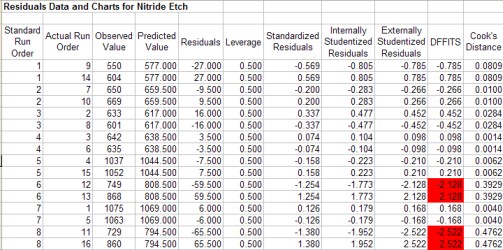
- Standard Run Number: the standard run number from the design table
- Actual Run Number: the actual run number based on the randomized design
- Observed Value: the value of the response variable for the run
- Predicted Value: the value of the response variable predicted from the model
- Residual: the difference between the observed value and the predicted value
- Leverage: the amount of leverage (influence) the run has on the predicted value; the leverage values are obtained from the diagonal element of the hat matrix; if the leverage for a run is greater than 2p/n, then this run is a high-leverage point and should be investigated further; p is the number of terms in the model and n is the number of runs; the hat matrix is given by H=X(X’X)-1X’
- Standardized Residuals: provides a rough check for outliers; determined by dividing each residual by the square root of the mean square error; any value outside +/- 3 is a possible outlier
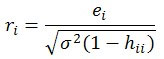
- Internally Studentized Residuals: take into account the inequality of variances across the factor space, any value outside +/- 3 is a possible outlier, defined as (sigma squared is the mean square error):
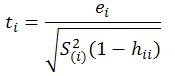
- Externally Studentized Residuals: uses a different estimate of sigma than MSE in the above equation; estimates sigma based on a data set with the ith observation removed:
- The externally studentized residual is the defined as (any value outside +/- 3 is a possible outlier):
- DFFITS: measures the deletion influence of run i; if absolute values is greater than 2*sqrt(p/n) , the run is influential
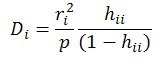
- Cook’s Distance: indicates the difference between the calculated b values and the values one would have obtained, had a run been excluded; all distances should be of about equal magnitude; if not, then there is reason to believe that the run biased the estimation of the regression coefficients; values greater than 1 are influential; defined as the following: