DOE Optimization Help
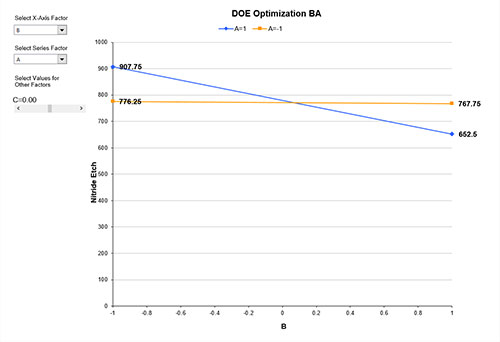
This sheet contains a chart where you can easily see the impact of changing the value of the variables on the response factor. The coded factors are used. This sheet will work for three to six factors. The optimization chart is shown below. You make changes to the chart using the boxes in the upper left-hand corner. These are described below.
- Select X-Axis Factor: this selects the factor to be displayed on the X axis.
- Select Series Factor: this selects the factor for the lines to be drawn on the chart for the factor levels of -1 and 1.
- Select Values for Other Factors: up to four factors will be listed here; use the scroll to change the value of a factor; default value is 0.

