Half-Normal Plot of Effects Help
This sheet contains the half-normal plot of effects as shown below. The absolute value of the effects is used in this plot.

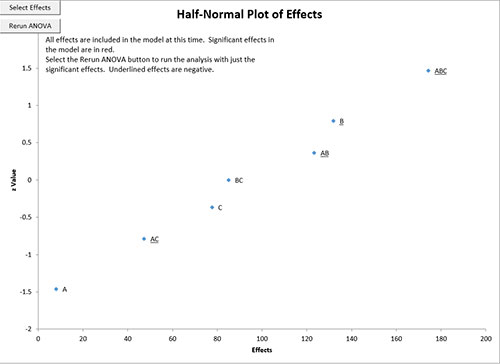
You will see the following in the upper left-hand corner of this chart the first time it is made:
- “All effects are included in the model at this time. Significant effects in the model are in blue.Select the Rerun ANOVA button to run the analysis with just the significant effects. Underlined effects are negative.”
All the effects are included in the model when it is first run. On this sheet, the significant effects from the design table analysis are in blue.
You can select additional effects to include in the model by selecting the “Select Effects” button or you can re-run the ANOVA analysis using the selected effects (in blue) by selecting the “ANOVA” button. These two buttons will be in the upper left-hand corner of the chart.
If you select “Select Effects”, the following input screen is displayed:
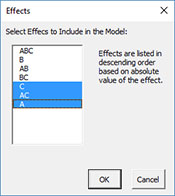
Select the factor you want to include in the model. The shaded factors are the significant factors. You can de-select these if you wish. Then select OK.
Select “ReRun ANOVA” to re-run the analysis with the selected factors.
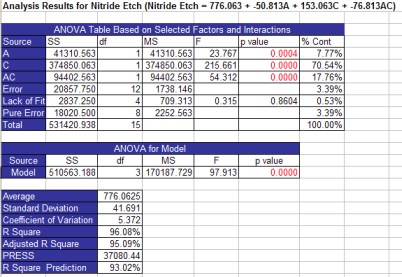
The program will add two new worksheets called “Current Model Analysis” and “Model Residuals” and change the Residuals Plots sheet. The worksheet “Current Model Analysis” contains the same information of the “All Factors Analysis” worksheet except that is for the terms in the model. The design table is not included. The output for the top part of worksheet in the current example is shown below. The “Model Residuals” worksheet contains the same information as the “All Factors Residual Info” worksheet except that is based on the terms in the current model. The “Residuals Plots” sheet now contains the information for the current model.
If you return to the “Half-Normal Plot of Effects” sheet, select different terms and rerun the ANOVA analysis, the three worksheets above will be changed to reflect the terms you included in the model.