Type 1 Gage Study Help
Home » SPC for Excel Help » Analysis Help » Measurement Systems Analysis Help » Type 1 Gage Study Help
This help page shows how to setup and run at Type 1 Gage Study. The data used can be downloaded at this link.

- 1. To start the analysis, select “MSA” from the “Analysis” panel on the SPC for Excel ribbon. Then select “Gage R&R Studies” and “Type 1 Gage Study”.
- 2. A Type 1 Gage Study worksheet is added to the workbook. This is where you enter the information and results.
- 3. Enter the information into the top part of the worksheet. There is a comment in each cell in rows 3 to 14 in column A that explain the entry. Each entry is explained below.
- Study: optional, name of study
- Date: optional, date Gage R&R performed
- Gage: optional, name of gage
- Characteristic: optional, characteristic being measured
- Operator: optional, name of operator performing the repeated measurements
- Analyzed By: optional, name of person doing the analysis
- USL: required to have USL and/or LSL
- LSL: required to have USL and/or LSL
- % Tolerance for Cg: required percent of tolerance used to calculate Cg; default is 20
- Standard Deviation Multiplier: required default is 6; study variation is this number times the standard deviation; 6 captures 99.73% of the measurements
- Measurement Increment: required used to determine if resolution is less than or equal to 5% of the tolerance
- Reference Value: required used to determine bias
- 4. Enter the sample number, result, and comment (optional).
- 5. The results are now ready to be analyzed. To analyze the results, select “MSA” from the “Analysis” panel on the SPC for Excel ribbon.
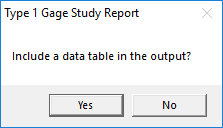
- 6. The option to add a data table to the report is displayed. Select yes or no.
- 7. A worksheet containing the output of the detail or summary report analysis is added to the workbook. A pdf file containing the detailed report with a description of the output is given at this link. The output includes:
- Statistics such as average and standard deviation
- Run chart
- Bias
- Capability assessment
- Histogram with reference value
- Data table
See the link above for more information on the output.