Remove/Add Back All Points Beyond the Control Limits Help
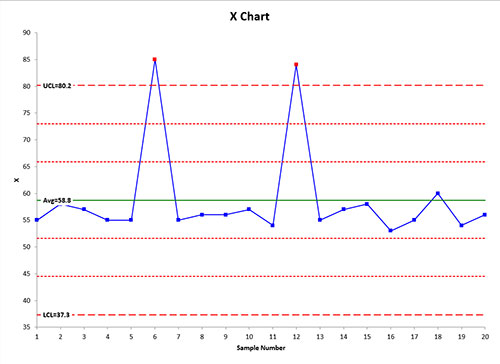
The X chart for these data are shown below.

There are two out of control points on this chart – two above the upper control limit. You know the reason for both out of control points and would like to remove the points from the calculations. You could select each point on the chart individually and remove them one at time (see Remove/Add Back Point to Calculations). You can also remove them both at once by using the Remove/Add Back All Points Beyond the Control Limits option by following these steps:
- 1. Select the chart
- 2. Select “Actions” in the “Control Charts” panel on the SPC for Excel ribbon to display the Control Chart Actions form.
- 3. Select the “Remove all points beyond the control limits from the calculations” option in the “Multiple Points Action” section.
- 4. Select OK on the “Control Chart Actions” form.
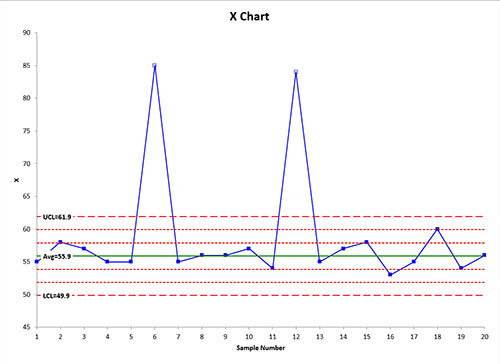
The control chart is then updated with the points beyond the control limits removed from the calculations. Note that the average and control limits have changed since the out of control points beyond the control limits have been removed.

Note: it is possible that the updated control chart will have additional out of control points. To remove those, you will need to run this option again.
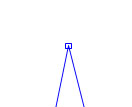
You can tell from the chart if a point has been deleted from the calculations. It will have a border only but no fill as shown below:

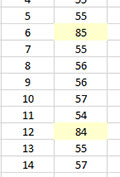
Removing a point from the calculations does change the worksheet containing the data. The values that have been deleted has been shaded:

To add the points back to the chart, repeat the above process but select the “Add back all points beyond the control limits to the calculations” option The shading on the worksheet will be removed when the points are added back to the calculations.

