Select Range for Average and Control Limits Help
Home » SPC for Excel Help » Control Charts Help » Control Chart Actions » Multiple Points » Select Range for Average and Control Limits Help
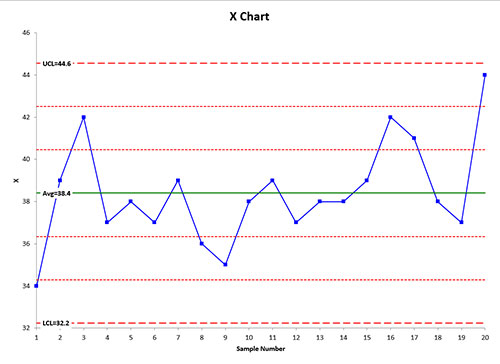
The X chart for these data are shown below.

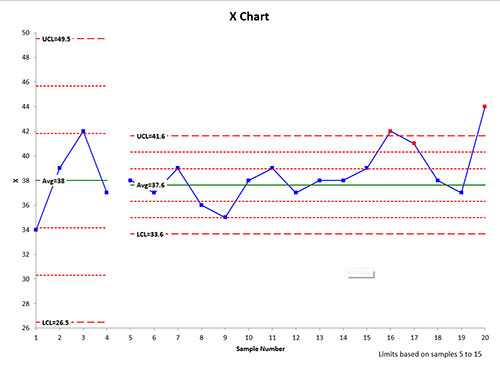
The X chart for these data are shown below.
- 1. Select the chart
- 2. Select “Actions” in the “Control Charts” panel on the SPC for Excel ribbon to display the Control Chart Actions form.
- 3. Select the “Select subgroup (sample) range on which to base average and control limits” option in the “Multiple Points Action” section.
- 4. Select OK on the “Control Chart Actions” form.
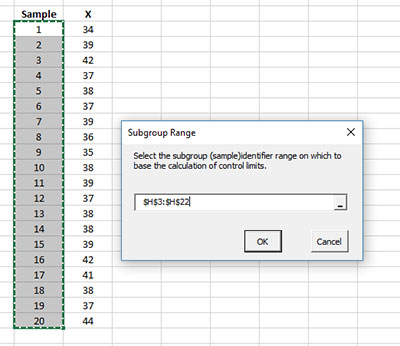
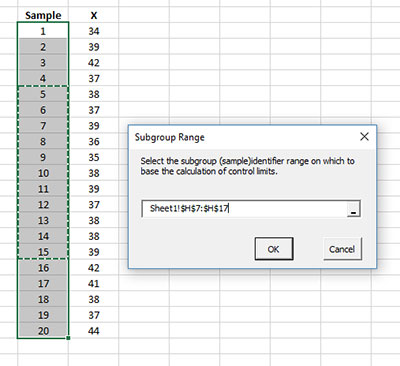
- 5. An input screen is displayed that lists all the subgroup (sample) identifiers.

- 6. Select the range on which to base the average and limits (in this case, samples 5 to 15).

- 7. Select OK. The control chart is updated with the average and control limits based on the range selected.

The software treats the data before sample 5 as a split control limit. The range the control limits are based on (from sample 5 on) is shown in the lower right hand corner of the chart.
Setting the range for the average and control limits does make a change to the worksheet containing the data. The starting point of the range has the X value (or first value in a subgroup) underlined. The same is true for the last point in the range.

When the range has been set, the option to automatically update the control limits for the chart is set to No.
You can remove the range by selecting the “Options” in the “Updating/Options” panel of the SPC for Excel ribbon and selecting the chart name. Then change the option for “Automatically Updating of Limits” to yes. See “Changing Chart Options” for more information.

