Add/Remove/Delete Comments Help
Home » SPC for Excel Help » Control Charts Help » Control Chart Actions » Single Point » Add/Remove/Delete Comments Help
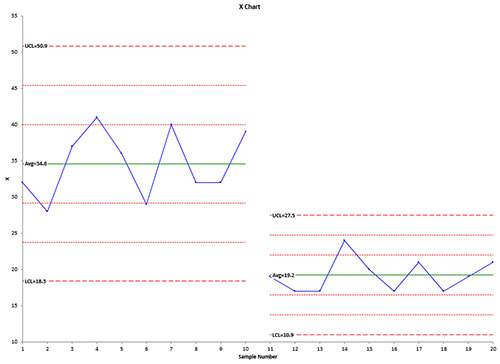
To understand how to add, revise, or remove comments, we will use the dataset on the help page on Split Control Limits. The control chart from that data set with the control limits split is shown below.

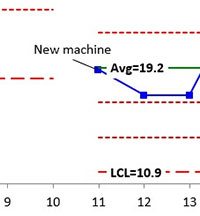
Suppose you want to add a comment at point 11 to say why the process shifted down. To use the add/remove comments option, you must select a point on the control chart before you select “Actions” from the “Control Charts” panel on the SPC for Excel ribbon. This is a two-step process in Excel. First select the series containing the results (e.g., subgroup averages). The entire series is selected. Then select the point where you want to add/remove the comment. See Split Control Limits if you need more information on how to select the point on the chart.
Once the single point is selected, Select “Actions” in the “Control Charts” panel on the SPC for Excel ribbon.
To add or replace a comment, select the “Add or replace comment for this point” from the Control Chart Actions form and enter the comment in the text box.
The comment is then added to the chart as shown below.
To remove the comment, repeat the process above but select the “Delete existing comment for this point” option.
Adding a comment to your chart does change the worksheet containing the data. The comments are inserted as cell comments in the worksheet.
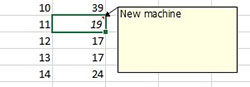
This gives you another way of adding or deleting comments to a chart. Go to your worksheet containing the data. Select the X value (or first X value if using subgroups) where you want to add a comment and add a cell comment. Or to delete the comment, delete the existing cell comment. Then go to Update Charts and select your chart to update.
Notes:
- Adding comments directly to a point on the chart will be overridden by the software.