Make Subgroups From Single Column Help
Home » SPC for Excel Help » Control Charts Help » Control Chart Actions » Worksheet Actions » Make Subgroups From Single Column Help
The software has the option to make subgroups from a single column of numbers. This page explains how to do this using the data that can be downloaded at this link.

You would like to start the control chart a point 11. You do this by following these steps:
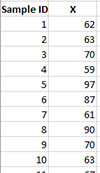
- 1. Enter the data into a single column shown below. The data are under the “X” column. The “Sample ID” column is optional (see below).
- 2. Select the data you want to make into subgroups (the data only, not any sample identifier).
- 3. Select “Actions” in the “Control Charts” panel on the SPC for Excel ribbon to display the Control Chart Actions form.
- 4. Select the ”Make subgroups from single column” option.
- 5. Select OK on the “Control Chart Actions” form. The input screen below is shown.
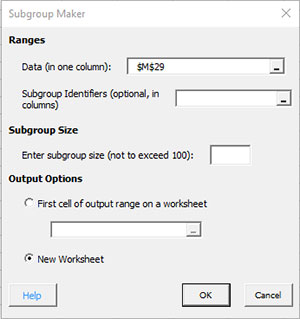
- Data: worksheet range containing the data; default is the range selected on the worksheet
- Subgroup Identifiers: worksheet range containing the subgroup identifiers (optional)
- Enter the subgroup size, not to exceed 100: This is the subgroup size you want from 2 to 100
- Output Options:
- First cell of output range on a worksheet: enter the cell location on the worksheet where you want the subgroups formed
- New worksheet: select this option to put the subgroups on a new worksheet
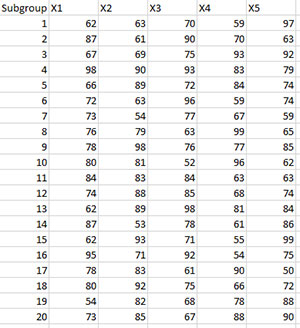
- 6. Select OK. The subgroups will be generated and placed based on your output option. The figure below shows part of the output to a new worksheet using a subgroup size of 5. The X1, X2, etc are the values in the subgroup.