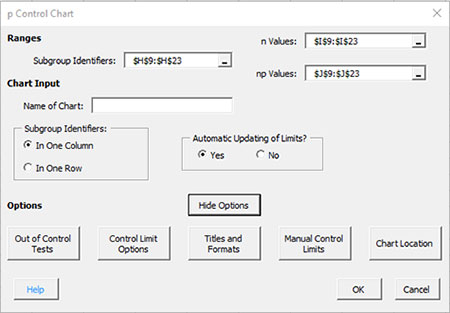
On the input screen for the chart, there is a button labeled “Show Options”. If you select that button, the input screen will show the options available for the chart. It is not required to select any of these options.

Each option is described below.
Out of Control Tests
If you select the Out of Control Tests, the input screen, Tests for Out of Control Points, is displayed.
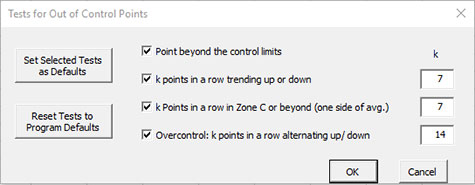
These options include:
- Point beyond the control limits: out of control point if there is a point that is above the upper control or below the lower control
- k points in a row trending up or down: out of control if there are k points in a row trending upward or trending downward; two points in a row that are equal break this trend
- k points in a row in Zone C or beyond (one side of avg): out of control if there is a run of k points in a row above or below the average
- Overcontrol: k points in row alternating up and down: out of control if k points in a row are such that the values alternate up and down
- Set Selected Tests as Defaults: this will set the selected test and k values as defaults for this type of chart
- Reset Tests to Program Defaults: resets the tests to the original program defaults for the type of chart
- Select OK to use selected options
- Select Cancel to revert to previous options
Control Limit Options
If you select the “Control Limit Options” button, the following is displayed.
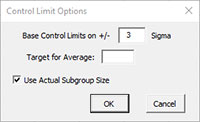
- Based Control Limits on +/- ___ Sigma: defines how to calculate the control limits; default is +/- 3 sigma
- Target for Average: option to enter a target for the average
- Use Actual Subgroup Size: option to use actual subgroup size to determine control limits if subgroup size varies; default is checked; if not checked, SPC for Excel uses the average subgroup size
- Select OK to use selected options
- Select Cancel to revert to previous options
Titles and Formats
If you select the “Title and Formats” button, the following screen is displayed:
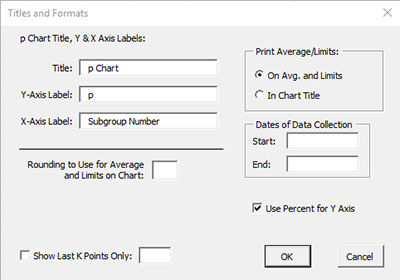
These options include:
- p Chart Title, Y & X Axis Label:
- Title: title at the top of the chart; default is “p Chart”
- Y-Axis Label: label to put on the chart vertical axis; default is “p”
- X-Axis Label: label to put on the chart horizontal axis; default is “Subgroup Number”
- Rounding to Use for Average and Limits on Chart: used to control the number of decimal places in the values of the average and control limits printed on the chart; default is estimated by the software
- Print Average/Limits:
- On Avg. and Limits: prints the values of the average and control limits on the average and control limit lines on the control chart (this is the default)
- In Chart Title: prints the values of the average and control limits in the control chart title
- Dates of Data Collection: enter the start and end dates of data collection; optional; dates will be plotted at the bottom of the chart
- Use Percent for Y Axis: default is to use percent for the p chart; if not checked, the p chart will display proportions.
- Show Last K Points Only: option to show only the last K points of the chart; calculations include all the data but only the last K points will be shown
- Select OK to use selected options
- Select Cancel to revert to previous options
Manual Control Limits
If you select the “Manual Control Limits” button, the following screen is displayed:
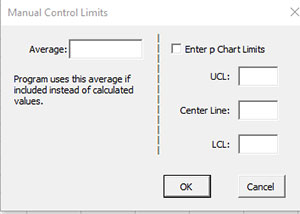
These options include:
- Average: enter the average to be used in the calculations
- Enter p Chart Limits: if you select this option, you must enter at least one of the UCL, centerline, and LCL; the software will calculate the values that are not entered
- UCL: enter the upper control limit
- Center Line: enter the center line value
- LCL: enter the lower control limit
- Select OK to use selected options
- Select Cancel to revert to previous options
Chart Location
If you select the “Chart Location” button, the following screen is displayed.
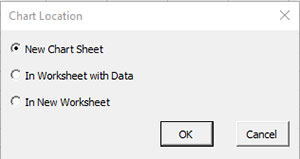
These options are:
- New Chart Sheet: places the chart on a new chart sheet (default)
- In Worksheet with Data: places the chart on the worksheet containing the data
- In New Worksheet: places both the on a new worksheet
- Select OK to use selected options
- Select Cancel to revert to previous options
Notes:
- Once a control chart is made, you can move the chart to new locations in the workbook. The software will find the chart when updating.
- This option is not available when a chart’s options are updated since you can manually move the charts to new locations in the workbook