Updating Control Charts with New Data
Home » SPC for Excel Help » Control Charts Help » Updating Control Charts with New Data
The software will update existing charts with new data that have been added to the worksheet. How the software finds the new data to add to the control chart is explained below along with how the control charts are updated. This example uses data that is in columns (subgroup identifiers in one column). The process is similar if the data are in rows.

Finding New Data
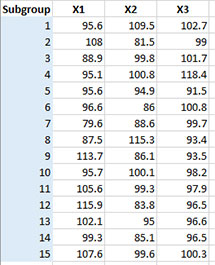
Suppose you have constructed a control chart using the data in the figure below. The data used in the chart is in subgroups 1 to 15 (cells A2 to A16), which is the blue shaded area. This subgroup range is saved as a named range in the workbook. The software uses the subgroup (or sample) range to find new data when you update a chart.
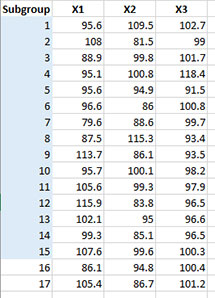
Suppose you have added two new subgroups to the data.
This is how the program looks for new data. It returns to the named subgroup range that is used in the chart. Then,
- If the cell below the last entry in the subgroup range is not empty, the software assumes that new data have been added. In this case, cell A17 contains a value (subgroup 16). The program then searches from the last cell in the subgroup range (A16) down until it finds the last entry before an empty cell. This becomes the new subgroup identifier range for updating the chart (A2 to A18).
- If the last entry in the subgroup range (A16) is not empty and the cell below that (A17) is empty, the software assumes there is no new data and the subgroup identifier range remains the same.
- If the last entry in the subgroup range (A16) is empty, the software assumes that data have been deleted. The program then searches from the last cell (A17) in the subgroup range up until it finds the first entry in an cell. This becomes the subgroup identifier range for updating the chart.
The subgroup (or sample) range is how the software checks for new data. You should always have a subgroup or sample identifier to ensure that the control chart updates correctly.
Updating the Control Chart
To update a chart, add new data to the spreadsheet containing the original data. The program will find the new data and add it to the chart.
To begin to update a chart, select the “Update Charts” on the “Updating/Options” panel on the SPC for Excel Ribbon.
An input screen containing all the charts available for update in the workbook will be displayed. An example of this input screen is shown below.
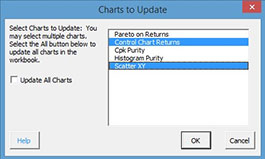
Select the charts you want to update. You can select one chart, multiple charts or all charts. Then select OK for the selected charts to update.