Levey-Jennings Chart Help
Home » SPC for Excel Help » Control Charts Help » Variable Control Charts Help » Individual Charts Help » Levey-Jennings Chart Help
A Levey-Jennings chart is often used by laboratories to determine if a certain test method is stable. A control is run on a regular basis (daily, once per shift, etc). The test result from running the control is plotted on the y-axis. The control number (or date) is plotted on the x-axis. Most the time, you will not see a moving range with a Levey-Jennings chart. However, this software gives you the option to include the moving range (with a moving range of two).
The Levey-Jennings chart is very similar to the individuals control chart. The difference is in how the control limits are calculated and the tests used to determine if the process is out of control. The Levey-Jennings chart uses the long-term estimate of the population standard deviation to set the three sigma limits. This is simply the standard deviation calculated using all the data. The individuals control chart uses the estimated standard deviation from the moving range chart. This is the short-term variation based on the within subgroup variation.

The Levey-Jennings chart does not use the basic tests for out of control points that apply to the individuals control chart. Instead, the Westgard rules are applied. These are described below. It should be noted that a moving range chart is not used with a Levey-Jennings chart.
The data used below to demonstrate how to make a Levey-Jennings can be downloaded at this link. This page contains the following:
Data Entry
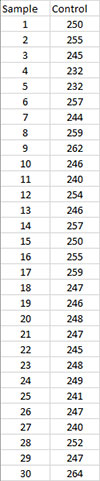
A lab runs a cholesterol test. To monitor the test, they run a control daily. The control value is 250 mg/dL. They have data for 30 days. The data are entered into a worksheet as shown below. The data can be anywhere on the worksheet and can be in columns (sample identifiers in one column) or in rows (sample identifiers in one row). In the example workbook, the data starts in cell A11.
Creating a New Levey-Jennings Chart
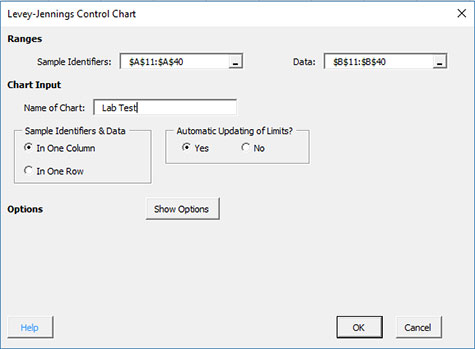
- 1. Select the data on the worksheet to be included in the analysis. The data to select is shaded below.
- 2. Select “Variable” from the “Control Charts” panel on the SPC for Excel ribbon.
- 3. The input screen for variable control charts is displayed. The Levey-Jennings chart is listed on the second tab (Individuals Charts) of input screen.
- 4. The input screen for the Levey-Jennings chart is display. The program sets the initial sample identifiers (A11:A40 in the example workbook) and data (B11:B40) ranges based on the range selected on the worksheet. You can edit the ranges if needed here. Enter a name for the chart. This is all that is needed to make the chart. In this example, the name “Lab Test” is used as the name. This name must be unique – no other worksheet tabs can have this name.
Selecting OK at this point will generate the Levey-Jennings chart. No other entries are required.
The options are:
- Sample Identifiers: worksheet range containing the sample identifiers
- Data: worksheet range containing the data
- Name of Chart: chart name – must be a unique name in the workbook and is limited to 25 characters
- Sample Identifiers: this information is used to search for new data when updating the chart (see below)
- In One Column: the sample identifiers are in one column (as in this example)
- In One Row: the sample identifiers are in one row
- Automatic Updating of Limits: option controls whether the average and control limits are updated as new data are added, default value is Yes; set this to No to stop the average and control limits from updating
- Show Options: selecting this button shows the various options for this chart (see options below)
- Out of Control Tests
- Control Limit Options
- Titles and Formats
- Manual Control Limits
- Chart Location
- Box-Cox Transformation
- Select OK to create the chart
- Select Cancel to exit the software
- 5. Once you have entered the information, select OK and the chart. An example based on the data above is shown below.
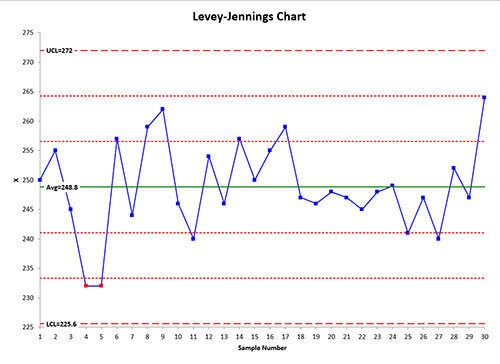
Note: this example plotted the average of the sample results. If the control value is known (in this example, the control value is 250), it can be used in place of the average. This is done with the option “Manual Control Limits” (see below). With this option, the average can be manually set to 250.
Options for the Levey-Jennings chart
On the input screen for the chart, there is a button labeled “Show Options”. If you select that button, the input screen will show the options available for the chart. It is not required to select any of these options.
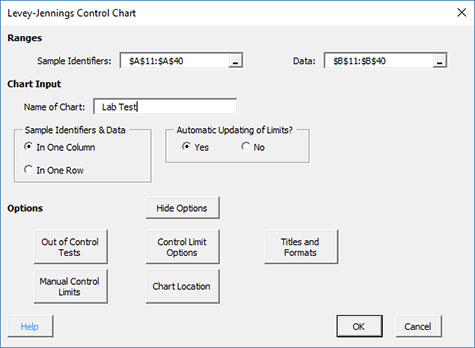
The options are explained below.
Out of Control Tests
If you select this option, the input screen below is shown.
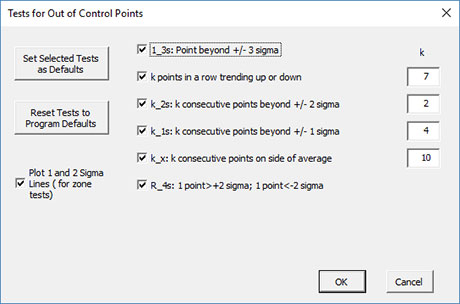
The out of control tests for the Levey-Jennings chart are known as the Westgard rules. They are as follows:
- 1_3s: Point beyond +/3 sigma – this test sends a signal when a point exceeds +/- three standard deviations.
- k points in a row trending up or down – default is 7 points in a row trending up or down (not part of the Westgard rules)
- k_2s: k consecutive points beyond +/1 2 sigma – default is 2 consecutive points beyond +/- 2 standard deviations
- k_1s: k consecutive points beyond +/- 1 sigma – default is 4 consecutive points exceeding +1 standard deviation or 4 consecutive points exceeding -1 standard deviation
- k_x: k consecutive points on one side of the average: default is 10 consecutive points on one side of the centerline.
- R_4s: 1 point > +2 sigma; 1 point < -2 sigma – this test sends a signal when one point is beyond +2 standard deviations and the following point is beyond -2 standard deviations or vice-versa.
- Set Selected Tests as Defaults: this will set the selected test and k values as defaults for the Levey-Jennings chart
- Reset Tests to Program Defaults: resets the tests to the original program defaults for the Levey-Jennings chart
- Plot 1 and 2 Sigma Lines (for zone tests): select this option to plot the 1 and 2 sigma lines on the control chart; this option is overridden by the option to add two additional lines on the control limit options (see below).
Control Limit Options
If you select this option, the input screen below is shown.
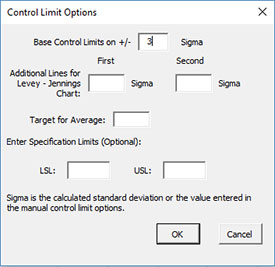
The options include:
- Based Control Limits on +/- ___ Sigma: defines how to calculate the control limits; default is +/- 3 sigma
- Additional Lines for Levey-Jennings Chart: the software allows you to add two additional lines to the chart based on multiple of sigma; additional lines are added above the average and below the average; this option will override the option of putting the 1 and 2 sigma lines shown on the Out of Control Test options above.
- Select OK to use selected option
- Select Cancel to revert to previous option
Titles and Formats
If you select the “Title and Formats” button, the following screen is displayed:
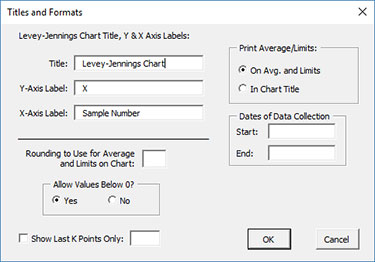
The options include:
- Levey-Jennings Chart Title & Y Axis Label:
- Title: title at the top of the chart; default is “Levey_Jennings Chart”
- Y-Axis Label: label to put on the chart vertical axis; default is “X”
- X-Axis Label: label to put on the chart horizontal axis for the Levey-Jennings chart; default is “Sample Number”
- Rounding to Use for Average and Limits on Chart: used to control the number of decimal places in the values of the average and control limits printed on the chart; default is estimated by the software
- Allow Values Below 0?: select Yes to allow values below 0 on the chart; select No to keep the chart from showing anything below 0; default is Yes
- Print Average/Limits:
- On Avg. and Limits: prints the values of the average and control limits on the average and control limit lines on the control chart (this is the default)
- In Chart Title: prints the values of the average and control limits in the control chart title
- Dates of Data Collection: enter the start and end dates of data collection; optional; dates will be plotted at the bottom of the chart
- Show Last K Points Only: option to show only the last K points of the chart; calculations include all the data but only the last K points will be shown
- Select OK to use selected options
- Select Cancel to revert to previous options
Manual Control Limits
If you select the “Manual Control Limits” button, the following screen is displayed:
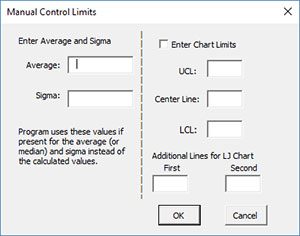
The options include:
- Enter Average and Sigma: the software uses these input values instead of those calculated by the software
- Average: enter the average to be used in the calculations
- Sigma: enter the standard deviation to be used in the calculations
- Enter Chart Limits: if you select this option, you must enter at least one of the UCL, centerline, and LCL; the software will calculate the values that are not entered
- UCL: enter the upper control limit
- Center Line: enter the center line value
- LCL: enter the lower control limit
- Additional Lines on LJ Chart: the software allows you to plot two other lines with manual entry; lines are plotted above and below the center line; this option overrides the options above to plot lines at +/- x sigma.
- Select OK to use selected options
- Select Cancel to revert to previous options
Chart Location
If you select the “Chart Location” button, the following screen is displayed.
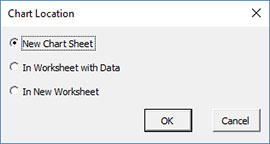
The options are:
- New Chart Sheet: places the Levey-Jennings chart on a new chart sheet
- In Worksheet with Data: places the Levey-Jennings chart on the worksheet containing the data
- In New Worksheet: places both the Levey-Jennings on a new worksheet
- Select OK to use selected options
- Select Cancel to revert to previous options
Notes:
- Once a control chart is made, you can move the chart to new locations in the workbook. The software will find the chart when updating.
- This option is not available when a chart’s options are updated since you can manually move the charts to new locations in the workbook
Changing the Options for the Levey-Jennings Chart
You can change the current options for an existing Levey-Jennings chart (e.g., adding a Box-Cox transformation) by selecting “Options” on the Updating/Options panel on the SPC for Excel Ribbon.
The list of available charts in the workbook will be displayed. Select the chart you want to change options for. The input screen for that chart will be shown and changes can be made. See Changing Chart Options for more information.
In addition, once a control chart is made, there are numerous actions you can take on the chart including splitting control limits, removing points from the calculations, adding comments, selecting the range on which to base control limits, etc. Please see Control Chart Actions for details.