Non-Normal X-mR Chart Help
Home » SPC for Excel Help » Control Charts Help » Variable Control Charts Help » Individual Charts Help » Non-Normal X-mR Chart Help
Control charts are very robust to the type of distribution the process has. However, there may be times you wish to fit your distribution and use that distribution to define the control limits. The SPC for Excel software does this for charts with individual values. This page shows you how to make the non-normal X-mR control chart. The data can be downloaded at this link. This page contains the following:

Data Entry
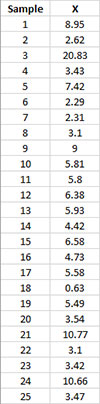
The data below will be used. The data were generated using a random number generator for a Gamma Distribution with the shape parameter = 3 and the scale parameter = 2. You enter the data into a worksheet as shown below. The data can anywhere on the worksheet and can be in columns (sample identifiers in one column) or in rows (sample identifiers in one row).
Creating a New Non-Normal X-mR Chart
- 1. Select the data on the worksheet to be included in the analysis. This is the shaded area shown below. You can use “Select Cells” in the “Utilities” panel of the SPC for Excel ribbon to quickly select the cells.
- 2. Select “Variable” from the “Control Charts” panel on the SPC for Excel ribbon.
- 3. The input screen for variable control charts is displayed. The Non-Normal X-mR chart is listed on the second tab (Individuals Charts) of input screen.
- 4. Select “Non-Normal X-mR Chart” from the “Individuals Charts” tab. Select OK.
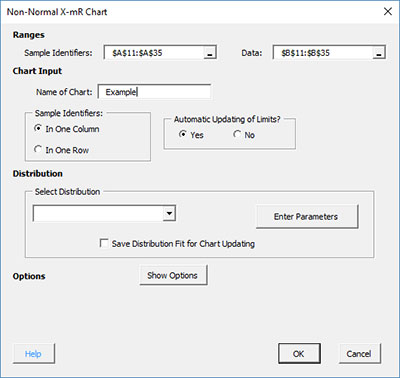
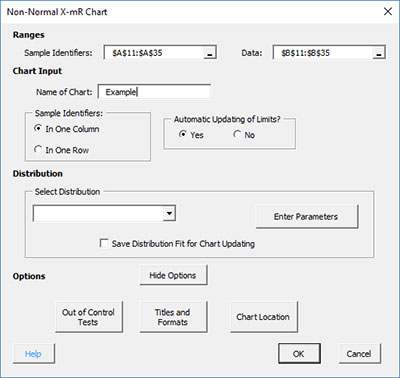
- 5. The input screen for the non-normal X-mR Chart is then displayed. The program sets the initial sample identifiers and data ranges based on the range you selected on the worksheet. This is why there is an advantage to selecting the sample and data ranges prior to making the control chart. You can edit the ranges if needed here. Enter a name for the chart. In this example, the name “Example” is used as the name of the non-normal X-mR chart. This is the name that will appear on the worksheet tab containing the control chart. It must be unique – there can not be another workbook tab with that name.
This is all that is needed to make the non-normal X-mR chart. If you select OK at this point, the software will generate the control chart using the default options. Simple and quick.
The options are:
- Sample Identifiers: worksheet range containing the sample identifiers
- Data: worksheet range containing the data
- Name of Chart: chart name – must be a unique name in the workbook and is limited to 25 characters
- Sample Identifiers: this information is used to search for new data when updating the chart (see below)
- In One Column: the sample identifiers are in one column (as in this example)
- In One Row: the sample identifiers are in one row
- Automatic Updating of Limits: option controls whether the average and/or control limits are updated as new data are added, default value is Yes; set this to No to stop the average and control limits from updating
- Distribution: this portion controls the type of distribution and its parameters (see below)
- Select Distribution: selects the distribution to use (gamma in this example)
- Enter Parameters: option to enter the distribution’s parameters (shape = 3 and scale = 2 for this example)
- Save Distribution Fit for Chart Updating: this option saves the distribution for when the chart is updated
- Show Options: selecting this button shows the various options for this chart (see options below)
- Out of Control Tests
- Titles and Formats
- Chart Location
- Select OK to create the control chart
- Select Cancel to exit the software
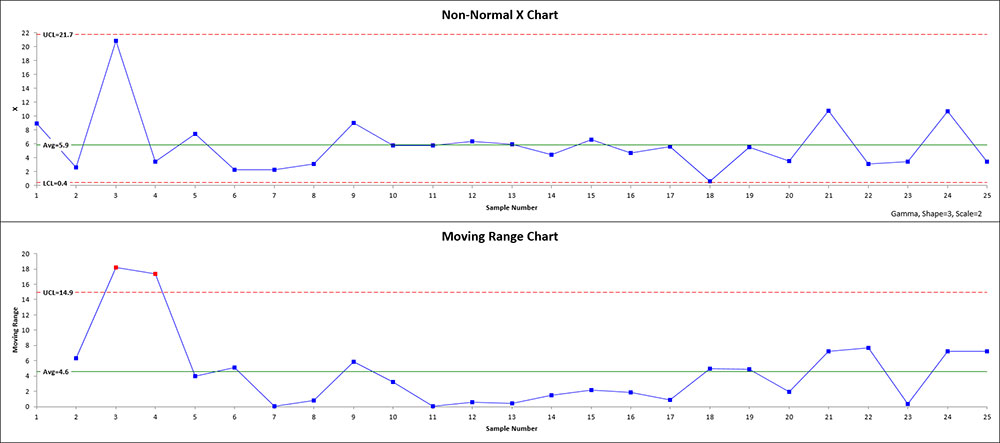
- 6. Once you have entered the information, select OK and the control chart will be generated. An example based on the data above is shown below. Note that the distribution and parameters are in the lower right hand corner of the X chart.
Distribution Options for the Non-Normal X Chart
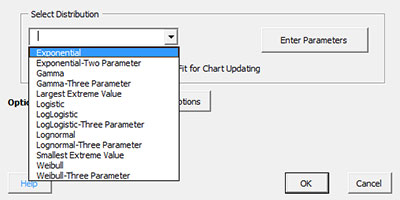
In the input screen above, there is a section titled “Select Distribution”. Selecting the arrow shows the available non-normal distributions:
Select the distribution you want to use. If you are not sure which distribution fits best, you can run “Distribution Fitting” from the SPC for Excel ribbon. You can either choose to enter the parameters (if you have determined the parameters from distribution fitting) or let the program calculate the parameters. To enter the parameters, select the distribution you want (Gamma in this example) and select the “Enter Parameters” button. The screen below is displayed.
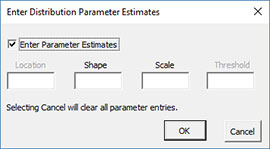
The name of the selected distribution is shown at the top. Select Enter Parameters and the parameters available for that distribution can be entered (shape and scale for the Gamma distribution). If you select Cancel, all parameters are cleared.
Options for the Non-Normal X-mR chart
On the input screen for the non-normal X-mR chart, there is a button labeled “Show Options”. If you select that button, the input screen will show the options available for the chart. It is not required to select any of these options.
Each option is described below.
Out of Control Tests
If you select the Out of Control Tests, the input screen, Tests for Out of Control Points, is displayed below.
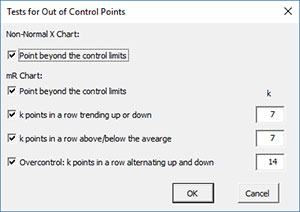
These options include only one test for the X chart:
- Point beyond the control limits: out of control if a point that is above the upper control or below the lower control
There are four tests for the mR chart:
- Point beyond the control limits: out of control if a point that is above the upper control or below the lower control
- k points in a row trending up or down: out of control if there are k points in a row trending upward or trending downward; two points in a row that are equal break this trend
- k points in a row in Zone C or beyond (one side of avg): there is a run of k points in a row above or below the average
- Overcontrol: k points in row alternating up and down: out of control if k points in a row are such that the values alternate up and down
Titles and Formats
If you select the “Title and Formats” button, the following screen is displayed:
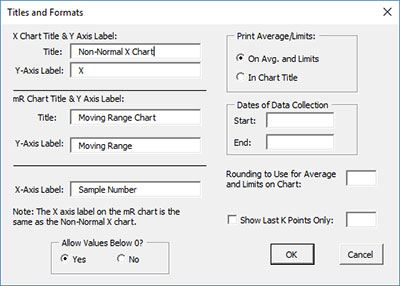
The options include:
- X Chart Title & Y Axis Label:
- Title: title at the top of the chart; default is “Non-Normal X Chart”
- Y-Axis Label: label to put on the chart vertical axis; default is “X”
- mR Chart Title & Y Axis Label:
- Title: title at the top of the range chart; default is “mR Chart”
- Y-Axis Label: label to put on the range chart vertical axis; default is “Moving Range”
- X-Axis Label: label for the horizontal axis for both the X chart and the range chart; default is “Sample Number”
- Allow Values Below 0?: select Yes to allow values below 0 on the chart; select No to keep the chart from showing anything below 0; default is Yes
- Print Average/Limits:
- On Avg. and Limits: prints the values of the average and control limits on the average and control limit lines on the control chart (this is the default)
- In Chart Title: prints the values of the average and control limits in the control chart title
- Dates of Data Collection: enter the start and end dates of data collection; optional; dates will be plotted at the bottom of the chart
- Rounding to Use for Average and Limits on Chart: used to control the number of decimal places in the values of the average and control limits printed on the chart; default is estimated by the software
- Show Last K Points Only: option to show only the last K points of the chart; calculations include all the data but only the last K points will be shown
- Select OK to use selected options
- Select Cancel to revert to previous options
Chart Location
If you select the “Chart Location” button, the following screen is displayed.
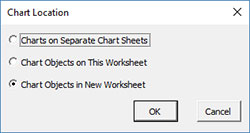
The options are:
- Charts on Separate Chart Sheets: places the X chart on one chart sheet and the mR chart on another chart sheet
- Chart Objects on This Worksheet: places both the X and mR chart on the worksheet containing the data
- Chart Objects in a New Worksheet: places both the X and mR chart on a new worksheet
- Select OK to use selected options
- Select Cancel to revert to previous options
Notes:
- Once a control chart is made, you can move the chart to new locations in the workbook. The software will find the chart when updating.
- This option is not available when a chart’s options are updated since you can manually move the charts to new locations in the workbook
Changing the Options for the Non-Normal X-mR Chart
You can change the current options for a non-normal X-mR chart (e.g., changing the distribution) by selecting “Options” on the Updating/Options panel on the SPC for Excel Ribbon.
The list of available charts in the workbook will be displayed. Select the chart you want to change options for. The input screen for that chart will be shown and changes can be made. See Changing Chart Options for more information
In addition, once a control chart is made, there are numerous actions you can take on the chart including splitting control limits, removing points from the calculations, adding comments, selecting the range on which to base control limits, etc. Please see Control Chart Actions for details.