Run Chart Help
Home » SPC for Excel Help » Control Charts Help » Variable Control Charts Help » Individual Charts Help » Run Chart Help
A run chart plots the points over time and adds an average or median line to the chart. It is not a control chart as such but you can apply some of the out of control chart tests. An example of how to make a run chart is shown below. The data can be downloaded at this link. This page contains the following:

Data Entry
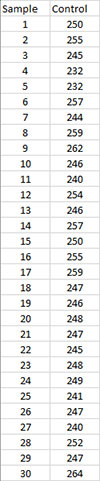
A lab runs a cholesterol test. To monitor the test, they run a control daily. The control value is 250 mg/dL. They have data for 30 days. The data are entered into a worksheet as shown below. The data can be anywhere on the worksheet and can be in columns (sample identifiers in one column) or in rows (sample identifiers in one row). The data starts in cell A11 in the example workbook.
Creating a New Run Chart
- 1. Select the data on the worksheet to be included in the analysis. The data to select is shaded below.
- 2. Select “Variable” from the “Control Charts” panel on the SPC for Excel ribbon.
- 3. The input screen for variable control charts is displayed. The run chart is listed on the second tab (Individuals Charts) of input screen. Select “Run Chart” and then OK.
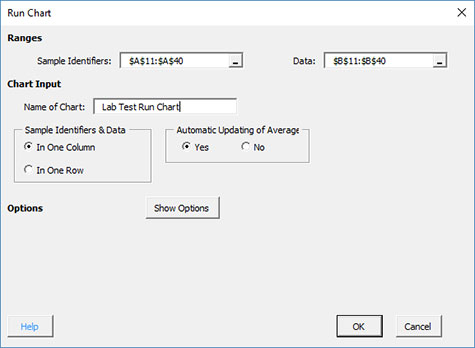
- 4. The input screen for the run chart is display. The program sets the initial sample identifiers (A11:A40 in the example workbook) and data (B11:B40) ranges based on the range selected on the worksheet. You can edit the ranges if needed here. Enter a name for the chart. This is all that is needed to make the chart. In this example, the name “Lab Test Run Chart” is used as the name. This name must be unique – no other worksheet tabs can have this name.
Selecting OK at this point will generate the run chart. No other entries are required.
The options are:
- Sample Identifiers: worksheet range containing the sample identifiers
- Data: worksheet range containing the data
- Name of Chart: chart name – must be a unique name in the workbook and is limited to 25 characters
- Sample Identifiers: this information is used to search for new data when updating the chart (see below)
- In One Column: the sample identifiers are in one column (as in this example)
- In One Row: the sample identifiers are in one row
- Automatic Updating of Average: option controls whether the average is updated as new data are added, default value is Yes; set this to No to stop the average from updating
- Show Options: selecting this button shows the various options for this chart (see options below)
- Out of Control Tests
- Control Limit Options
- Titles and Formats
- Manual Control Limits
- Chart Location
- Box-Cox Transformation
- Select OK to create the chart
- Select Cancel to exit the software
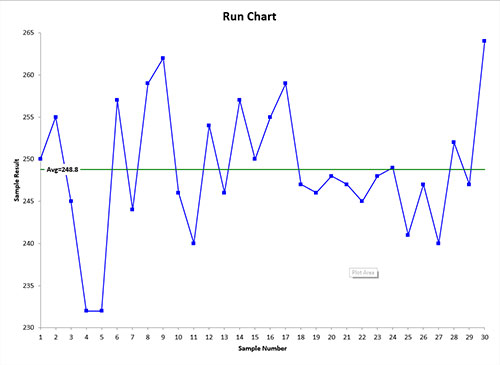
- 5. Once you have entered the information, select OK and the run chart will be generated. An example based on the data above is shown below.
Options for the Run Chart
On the input screen for this chart, there is a button labeled “Show Options”. If you select that button, the input screen will show the options available for the chart. It is not required to select any of these options.
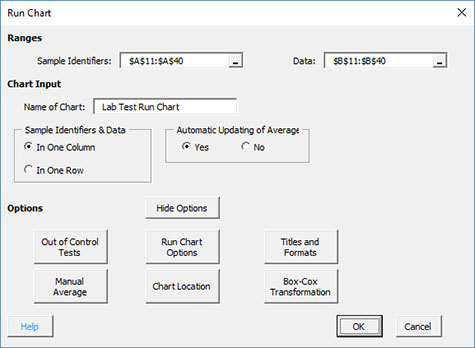
Each option is described below.
Out of Control Tests
If you select the Out of Control Tests, the input screen, Tests for Out of Control Points, is displayed below.
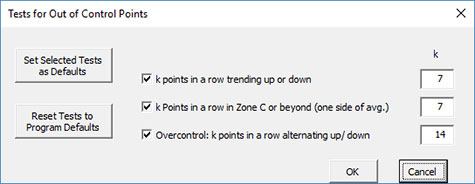
Only three tests apply.
- k points in a row trending up or down: out of control if there are k points in a row trending upward or trending downward; two points in a row that are equal break this trend
- k points in a row in Zone C or beyond (one side of avg): out of control of there is a run of k points in a row above or below the average
- Overcontrol: k points in row alternating up and down: out of control if k points in a row are such that the values alternate up and down
- Set Selected Tests as Defaults: this will set the selected test and k values as defaults for the type of chart
- Reset Tests to Program Defaults: resets the tests to the original program defaults for the type of chart.
Run Chart Options
If you select the Run Chart Options button, the following is displayed. Note that sigma is estimated from the moving range.
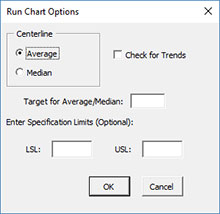
The options include:
- Centerline: the centerline can be the average or median
- Check for Trends: option to check for trends; if present, a trend chart will be made using the best-fit line
- Target for Average/Median: option to enter a target for the average/median
- Select OK to use selected options
- Select Cancel to revert to previous options
Note: the additional lines, check for trends, specifications, and target for average options apply only to the X chart.
Titles and Formats
If you select the “Title and Formats” button, the following screen is displayed:
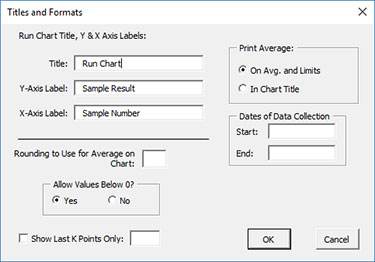
The options include:
- Run Chart Title & Y Axis Label:
- Title: title at the top of the chart; default is “Run Chart”
- Y-Axis Label: label to put on the chart vertical axis; default is “Sample Result”
- X-Axis Label: label for the horizontal axis for the Run chart; default is “Sample Number”
- Rounding to Use for Average on Chart: used to control the number of decimal places in the values of the average printed on the chart; default is estimated by the software
- Allow Values Below 0?: select Yes to allow values below 0 on the chart; select No to keep the chart from showing anything below 0; default is Yes
- Print Average/Limits:
- On Avg. and Limits: prints the values of the average and control limits on the average and control limit lines on the control chart (this is the default)
- In Chart Title: prints the values of the average and control limits in the control chart title
- Dates of Data Collection: enter the start and end dates of data collection; optional; dates will be plotted at the bottom of the chart
- Show Last K Points Only: option to show only the last K points of the chart; calculations include all the data but only the last K points will be shown
- Select OK to use selected options
- Select Cancel to revert to previous options
Manual Average
If you select the “Manual Average” button, the following screen is displayed:
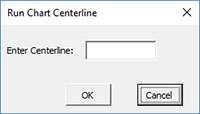
The options include:
- Enter Centerline and Sigma: the software use this value as the centerline instead of the average or median
- Select OK to use selected option
- Select Cancel to revert to previous option
Chart Location
If you select the “Chart Location” button, the following screen is displayed.
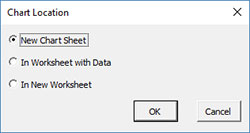
The options are:
- New Chart Sheet: places the run chart on a new chart sheet
- In Worksheet with Data: places the run chart on the worksheet containing the data
- In New Worksheet: places both the run on a new worksheet
- Select OK to use selected options
- Select Cancel to revert to previous options
Notes:
- Once a control chart is made, you can move the chart to new locations in the workbook. The software will find the chart when updating.
- This option is not available when a chart’s options are updated since you can manually move the charts to new locations in the workbook.
Box-Cox Transformation
Selecting the “Box-Cox Transformation” button displays the following screen:
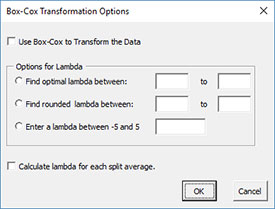
The options are:
- Use Box-Cox to Transform the Data: selecting this option reveals the bottom part of the input form
- Options for Lambda
- Find optimal lambda between: finds the value of lambda that minimizes the standard deviation between the default values of -5 and 5
- Find rounded lambda between: finds the rounded value of lambda that minimizes the standard deviation between the default values of -5 and 5; rounded value of lambda are -5, -4, -3, -2, -1, -.5, 0, .5, 1, 2, 3, 4 and 5
- Enter a lambda between -5 and 5: enter a value of lambda to use between the values of -5 and 5
- Calculate lambda for each split limit: this option will calculate the value of lambda for each set of split control limits
- Select OK to use selected options
- Select Cancel to revert to previous options
Notes:
- The default values of -5 and 5 can be changes when finding the optimal or rounded values of lambda, but must stay between -5 and 5.
- The standard deviation that is minimized is based on the option you selected to estimate sigma for the control chart (see Control Limit Options)
Changing the Options for the Run Chart
You can change the current options for an existing run chart (e.g., adding a Box-Cox transformation) by selecting “Options” on the “Updating/Options” panel on the SPC for Excel Ribbon.-
The list of available charts in the workbook will be displayed. Select the chart you want to change options for. The input screen for that chart will be shown and changes can be made. See Changing Chart Options for more information.
In addition, once a control chart is made, there are numerous actions you can take on the chart including splitting control limits, removing points from the calculations, adding comments, selecting the range on which to base control limits, etc. Please see Control Chart Actions for details.