Box-Cox Transformation Help
Home » SPC for Excel Help » Distributions Help » Data Transformation Help » Box-Cox Transformation Help
This page shows how to perform the Box-Cox Transformation using SPC for Excel. The data used can be downloaded at this link.

Running the Box-Cox Transformation
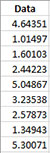
- 1. Enter data into a worksheet as shown below (only a portion of the 100 data points shown). The data can be in one column for individual values or multiple columns for sub grouped data.
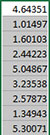
- 2. Select the data on the worksheet to be included in the analysis. This is the shaded area shown below. You can use “Select Cells” in the “Utilities” panel of the SPC for Excel ribbon to quickly select the cells.
- 3. Select “Data Transformation” on the “Distributions” panel on the SPC for Excel ribbon.
- 4. The input form below is displayed. Select the “Box-Cox Transformation” option.
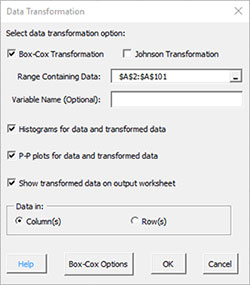
- Range Containing Data: select the range containing the data; the default is the range selected on the worksheet
- Variable Name (Optional): enter the name the variable (note: this will populate with the first cell in the selected range if it contains text)
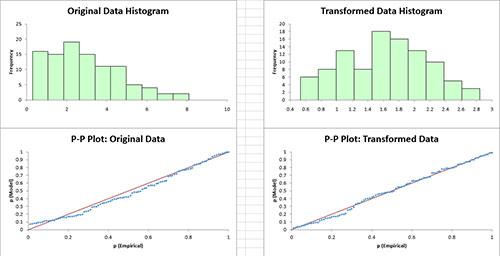
- Histograms for data and transformed data: this options creates histograms for the original data and the transformed data so you can visually see if the transformed data appears normal; default is Yes.
- P-P plots for data and transformed data: this options creates the P-P plot for the original data and the transformed data; if the data falls along a straight line, the data are normally distributed; default is Yes
- The P-P plot plots the empirical CDF against the theoretical CDF value.
- Show transformed data on output worksheet: this option prints the original data on the worksheet along with the transformed data
- One Subgroup or One Sample: option for individual values or subgroups
- In 1 row across columns (like this example; for individuals, this means that the data are across rows in one column)
- In 1 column across rows
- Box-Cox Options: see below
- Select OK to run the Box-Cox transformation
- Select Cancel to exit the program
- 5. If you select “Box-Cox Options”, the following input screen is displayed.
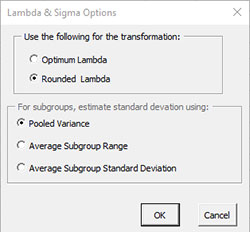
- Use the following for the transformation:
- Optimum Lambda: finds the value of lambda that minimizes the standard deviation between the default values of -5 and 5
- Rounded lambda: finds the rounded value of lambda that minimizes the standard deviation between the default values of -5 and 5; rounded value of lambda are -5, -4, -3, -2, -1, -.5, 0, .5, 1, 2, 3, 4 and 5; this is the default
- For subgroups, estimate standard deviation using:
- Pooled variance: this is the default
- Average Subgroup Range
- Average Subgroup Standard Deviation
- Select OK to keep options and return to Data Transformation input screen
- Select Cancel to reset options and return to Data Transformation input screen
Note: for individual values, the average moving range is used to estimate the standard deviation
Box-Cox Transformation Output
Two sheets are added to the workbook. Both are named with a number following the name reflecting the number of times the Box-Cox transformation has been run in the workbook.
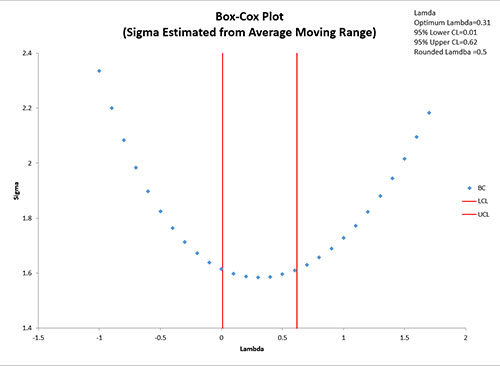
Box Cox Plot
This sheet contains a chart of sigma vs lambda along with the optimum lambda, the rounded lambda, the confidence limits for lambda as shown below. The red lines are the confidence limits.
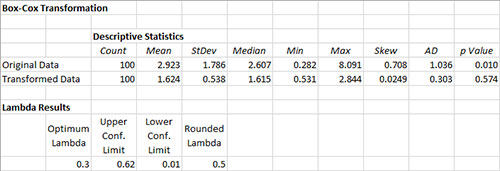
Box Cox Output
The top part of the worksheet contains the descriptive statistics as well as the Anderson-Darling statistic and p value. If the p value is less than 0.05, the distribution is not normally distributed. The lambda results are also given.
The middle part of the worksheet contains the histograms and P-P plots (if those options were selected).
The bottom part of the worksheet contains the transformed data if that options was selected.