Distribution Fitting Help
Home » SPC for Excel Help » Distributions Help » Distribution Fitting Help
This page shows how to use the distribution fitting in SPC for Excel. The SPC for Excel program fits data to different distributions using the maximum likelihood estimation approach. When there are no direct solutions to the equations, Solver is used to find a solution that minimizes the log-likelihood function subject to constraints on the parameters. SPC for Excel fits the following distributions:

- Exponential
- Exponential – Two Parameter
- Gamma
- Gamma – Three Parameter
- Largest Extreme Value
- Logistic
- LogLogistic
- LogLogistic – Three Parameter
- LogNormal
- LogNormal – Three Parameter
- Normal
- Smallest Extreme Value
- Weibull
- Weibull – Three Parameter
The distributions are defined by one or more of four parameters:
- Location
- Shape
- Scale
- Threshold
Running the Distribution Fitting
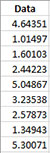
- 1. Enter data into a worksheet as shown below (only a portion of the 100 data points shown). The data can be downloaded at this link. The data can be in one column for individual values or multiple columns for subgrouped data.
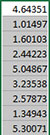
- 2. Select the data on the worksheet to be included in the analysis. This is the shaded area shown below. You can use “Select Cells” in the “Utilities” panel of the SPC for Excel ribbon to quickly select the cells.
- 3. Select “Distribution Fitting” on the “Distributions” panel on the SPC for Excel ribbon.
- 4. The input form below is displayed.
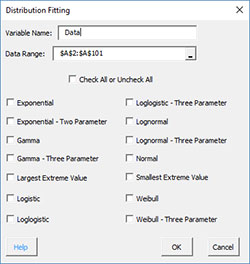
- Variable Name: enter the name of the variable; if the first cell in selected range is text, it is used as the variable name
- Data Range: enter the range containing the data; the default range is the selected range on the worksheet
- Check All or Uncheck All: will check or uncheck all distributions
- Select the distributions you want to fit
- Select OK to fit the selected distributions
- Select Cancel to end the program
Distribution Fitting Output
If more than one distribution is fitted, a worksheet named “Summary” is added to the workbook. The top part of this sheet contains the descriptive statistics for the original data. The results for the distribution fitting are then provided.
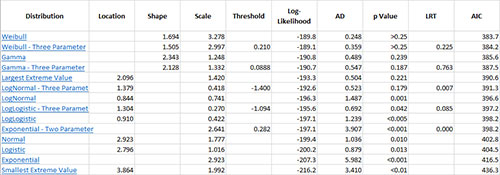
Each distribution is listed. Each distribution is a link that takes you to the worksheet containing the results for that distribution. The following are given for each distribution:
- Distribution parameters – location, shape, scale and threshold
- Log-Likelihood for the distribution
- Anderson-Darling statistics
- p values
- LRT
- AIC
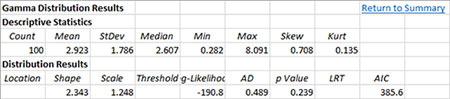
Clicking on one the distributions, takes you to the worksheet for that distribution results. The top part of the worksheet contains the name of the distribution, the descriptive statistics for the original data, the distribution results as explained above and a link to return to the summary.
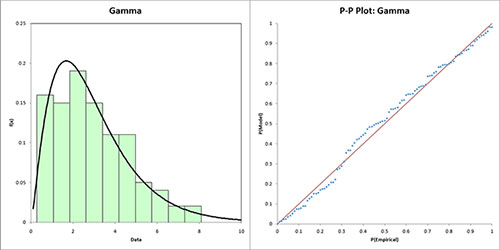
The bottom part of the worksheet contains the histogram of the data with the distribution superimposed and the P-P plot. If the points on the P-P plot lie along the straight line, the distribution fits the data.