Normal Probability Plot Help
Home » SPC for Excel Help » Distributions Help » Normal Probability Plot Help
This test helps determine if your data are normally distributed. Data that are normally distributed will fall close to a straight line on the normal probability plot. The normality test (e.g., Anderson-Darling) calculates a statistic that helps detect most departures from normality.
If the p value (probability) for the normality test statistic is less than 0.05, there is statistical evidence that the data are not normality distributed. If the p value is greater than 0.20, the conclusion is that the data are normally distributed. More data might be needed for values of p between 0.05 and 0.20. An example is given below.
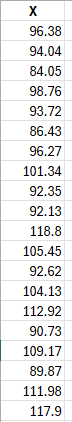
A hardness tester’s calibration is checked by testing a standard block once a day. The measurement error should be normally distributed. Data for the last 25 days is given below. That data can be downloaded at this link. We want to determine if the results are normally distributed.

- 1. Enter the data into an Excel worksheet. It has to be in one column; the first cells is assumed to the title if it is non-numeric.
- 2. Select the data.
- 3. Select the “Normal Probably Plot from the “Distributions” panel in the SPC for Excel ribbon.
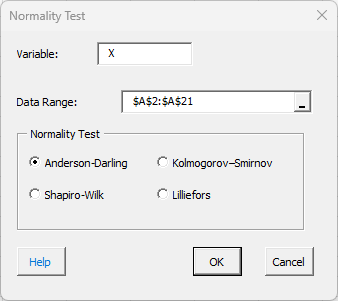
- 4. Select the normality test to use: Anderson-Darling, Kolmogorov-Smirnov, Shapiro-Wilk or Lillefors (which is Shapiro Wilk with a different method of determining the p value.
Normal Probability Plot Output
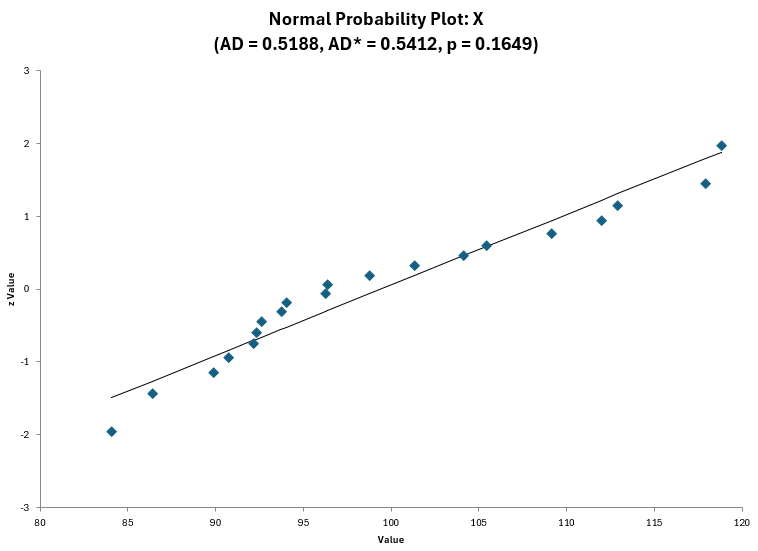
The program will generate the normal probability plot with the normality test selected. The plot below shows the Anderson-Darling statistic. The points generally lie along the straight line on the normal probability plot. The Anderson-Darling statistic is printed along with the p value, which in this case is 0.1649. Since it is greater than 0.05, you conclude that the data most likley comes from a normal distribution.
- Notes:
- AD is the corrected value of the Anderson-Darling statistic for sample size.
- You can also use Distribution Fitting to get more information about the fit.