Cpk Charts Help
Home » SPC for Excel Help » Process Capability Help » Cpk Charts Help
The Cpk chart shows how capable a process is of meeting specifications. The Cpk calculations assumes that your process is in statistical control, and that the data is normally distributed. For non-normal data, see “Non-Normal Ppk.” The Cpk chart can be easily updated with new data. This page shows you how to make a Cpk using the data that can be downloadedat this link. This page contains the following:

Data Entry
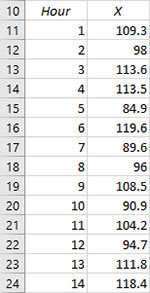
The data are entered into a worksheet as shown below (using the first part of the data into the example workbook). The data does not have to start in A1. It can be anywhere on the spreadsheet.
The data can be in either columns or rows. Note: if the data are in columns, the program will assume that the number of columns is equal to the subgroup size. If the data are in three columns, a subgroup size of three is assumed in the calculations by the program. Likewise for rows.
Creating a New Cpk Chart
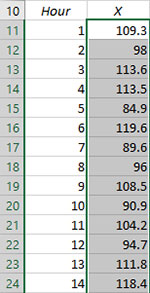
- 1. Select the data on the worksheet to be included in the analysis.
- 2. Select “Cpk” from the “Process Capability” panel on the SPC for Excel ribbon.
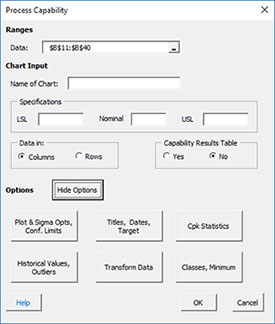
- 3. The input screen for the process capability is shown. The default data range is the range you selected on the worksheet. This will be the range that is included in the Cpk chart. You can edit the range if needed here.
- Enter a name for the chart. This is the name that will be on the worksheet tab containing the Cpk chart. In this example, the name “Cpk Example” is used as the name of the Cpk chart.
- Enter the specifications and the nominal (optional). At least one specification must be entered.
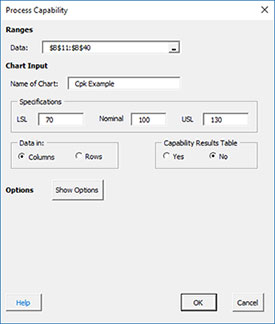
- Data: range containing the data to use in the Cpk Chart, may be edited if not correct
- Name of chart: chart name for worksheet tab containing the Cpk chart – must be a unique name in the workbook and is limited to 25 characters
- Specifications: the LSL, nominal, and USL; at least one specification is required
- Data in: columns (subgroup is in one row across columns) or rows (subgroup is in one column across rows); the program uses this information to search for new data when updating the chart
- Capability Results Table: selecting this option places a summary of the process capability results into a summary worksheet; this worksheet contains all the process capability results for the workbook if this option was selected; default value is No.
- Show Options: selecting this button shows the various options for the Cpk chart (see options below)
- Plot & Sigma Options, Confidence Limits
- Titles, Dates, Target
- Cpk Statistics
- Historical Values, Outliers
- Transform Data
- Classes, Minimum
- Select OK to create the Cpk Chart
- Select Cancel to exit the program
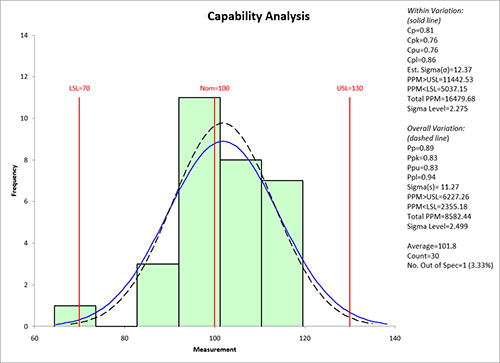
- 4. Once you have entered the information, select OK and the Cpk chart will be generated on a new chart sheet. An example based on the data above is shown below.
Options for the Cpk Chart
On the input screen for the Cpk chart is the button labeled “Show Options”. If you select that button, the input screen will show the options for the Cpk Chart. Each option is described below. It is not required to select any of these options.
Plot & Sigma Opts, Confidence Limits
Selecting this option displays the input screen below.
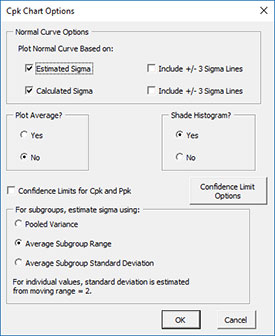
- Normal Curve Options: Plot Normal Curve Based on:
- Estimated Sigma (with option to include the +/- 3 sigma lines based on the estimated standard deviation from the range chart)
- Calculated Sigma (with option to include the +/- 3 sigma lines based on the calculated standard deviation)
- Default is to plot both curves but not either of the +/- 3 sigma lines
- Plot Average?: select Yes to plot the average; default is No
- Confidence Limits for Cpk and Ppk: select to include the confidence limits for Cpk and Ppk; default is No. The “Confidence Limit Options” box allows you to change from the default two-side confidence limit to either lower or upper and to change default alpha value of 0.05.
- Shade Histogram?: select Yes to shade the histogram; default is Yes
- For subgroups, estimate standard deviation using: for subgrouped data, there are three options: pooled variance, average subgroup range (default); or average subgroup standard deviation; for individuals data, the standard deviation is estimated from the moving range of 2.
Titles, Dates, Target
Selecting this option displays the input screen below.
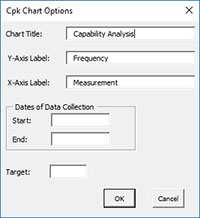
- Chart Title: the title for the Cpk chart, default is “Capability Analysis”
- Y-Axis Label: the label for the vertical axis; default is “Frequency”
- X-Axis Label: the label for the horizontal axis; default is “Measurement”
- Dates of Data Collection: option to enter starting and ending dates of data collection
- Target: target for production; not necessarily the nominal; if entered Cpm is calculated
- Select OK to use selected options
- Select Cancel to revert to previous options
Cpk Statistics
Selects which statistics to print out in the statistical data box on the process capability chart:
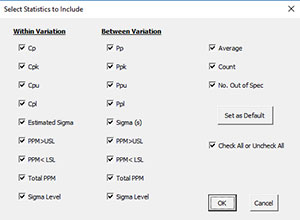
There is an option to check all or uncheck all. There is also the option to set this selection statistics as the default options for future process capability charts.
Historical Values, Outliers
Selecting this option displays the input screen below.
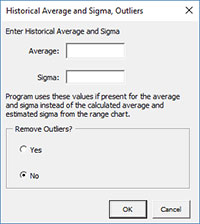
- Enter Historical Average and Sigma: option to enter an average and sigma; if entered the program uses these values instead of the calculated average and estimated standard deviation from the range chart
- Remove Outliers: option to remove outliers from the data; selecting Yes will display the “Beyond +/- __ Sigma”; the program will remove data beyond the multiplier of sigma used; the calculated standard deviation is used as the estimate of sigma; default is No.
Transform Data
You have the option to transform the data either with the Box-Cox or Johnson Transformations. Selecting this option displays the input screens shown below. If you select the “Transform the Data” option, you will have the option to select either the Box-Cox or the Johnson Transformations. Selecting the Box-Cox option displays this input screen.
- Run Transformation Now: performs the Box-Cox transformation
- Lambda to Use: option to use either the rounded lambda or the optimum lambda
- Enter Lambda: enter the lambda you want to use for the transformation
- Save Transformation for Chart Updating: saves the value of lambda for when the Cpk chart is updated
Selecting the Johnson Transformation displays the input screen below.
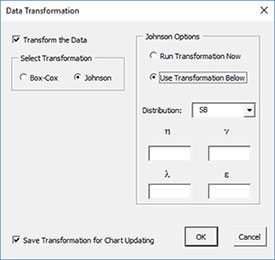
- Run Transformation Now: performs the Johnson transformation
- Use Transformation Below: option to enter the distribution and parameters
- Distribution: the distribution to use: SB, SL, SU
- ?, ?, ?, ?: the parameters used with the Johnson distribution
- Save Transformation for Chart Updating: saves the values of the Johnson transformation for when the Cpk chart is updated
Classes, Minimum
If you select the “Classes, Minimum” option, the following input screen will appear:
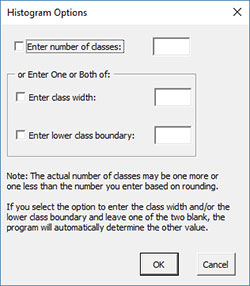
- Enter number of classes: this option sets the number of classes (bars) on the histogram
- Options for Lambda
- Enter lower class boundary: this option sets the lower boundary on the histogram
- Select OK to use selected options
- Select Cancel to revert to previous options
How SPC for Excel Finds New Data to Update the Cpk Chart
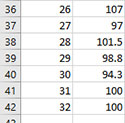
When a chart is updated, the program will search for new data based on the option selected for the data being in columns or rows (see the first input screen above). The figure below shows the data from the example workbook. The data range for the Cpk Chart was from B10 (see first figure above) to B40. Two data points have been added in B41 and B42. The chart is then updated.
This is how the program looks for new data:
- If the cell below the last entry in the data range is not empty, assume that new data are added. In this case, cell B41 contains a value. The program then searches from the last cell in the data range (B40) down until it finds the last entry before an empty cell. This becomes the new data range for updating the chart (B10 to B42).
- If the last entry in the data range (B40) is not empty, and the cells below that (B41) is empty, assume there is no new data and the data range remains the same.
- If the last entry in the data range (B40) is empty, assume that data has been deleted. The program then searches from the first cell (B10) down until it finds the last entry before an empty cell. This becomes the range for updating the chart.
The process works similarly if the data are in rows.
If you have empty cells in the data, consider putting a space in the empty cell or a character like N/A. The program ignores these types of entries in the calculations and the empty cells do not prevent the program from finding all the data.
Changing the Options for the Cpk Chart
You can change the current options for a Cpk Chart (e.g., adding +/- 3 sigma lines) by selecting “Options” on the Updating/Options panel on the SPC for Excel Ribbon.
The list of available charts in the workbook will be displayed. Select the chart you want to change options for. The input screen for that chart will be shown and changes can be made. See Changing Chart Options for more information.