Non-Normal Process Capability SnapShot Help
Home » SPC for Excel Help » Process Capability Help » Non-Normal Process Capability SnapShot Help
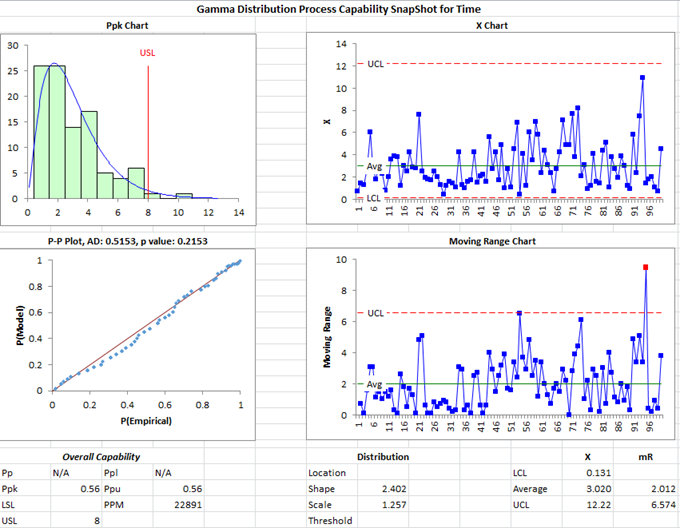
The Non-Normal Process Capability SnapShot technique provides a “snapshot” in time of your process capability. The “snapshot” includes these four items:
- Ppk (process capability) Chart: used to determine how well your process meets specifications; includes the histogram, the specifications, the non-normal curve for the distribution selected.
- Control Chart: used to determine if the process is in statistical control
- P-P Plot: compares the empirical cumulative distribution function with a specified theoretical cumulative distribution function to see how well the distribution fits the data
- Statistics: various metrics, such as Ppk and control limits to better understand the results
This page shows you how to create the Non-Normal Process Capability SnapShot using the data that can be downloaded at this link. This page contains the following:

Data Entry
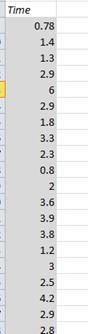
The data are entered into a worksheet as shown below (using the first part of the data into the example workbook). The data does not have to start in A1. It can be anywhere on the spreadsheet but must be in columns. Note: if the data are in columns, the program will assume that the number of columns is equal to the subgroup size. If the data are in three columns, a subgroup size of three is assumed in the calculations by the program.
Creating a Non-Normal Process Capability SnapShot
- 1. Select the data on the worksheet to be included in the analysis as shown by the shaded area above. You can also just put the cursor in the first cell of the data. The program will automatically select the data underneath that cell. If you select the cell “Time” above, it will use that cell as the name of the variable and will also automatically select all the data below it.
- 2. Select “SnapShot” from the “Process Capability” panel on the SPC for Excel ribbon.
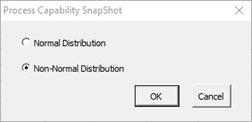
- 3. The form below is shown. Select “Non-Normal Distribution” to generate the results for a non-normal distribution.
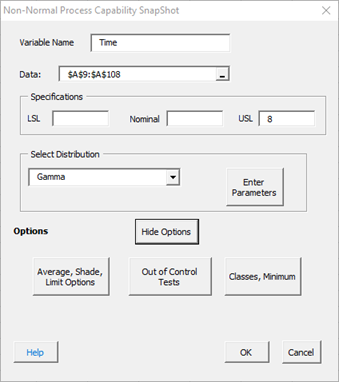
- 4. The input screen for the Non-Normal Process Capability SnapShot is shown. The data range is the range the program will use for the analysis. You can edit the range if needed here.
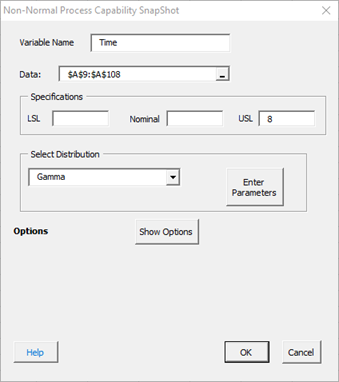
- Variable Name: name of the data.
- Data: range containing the data to use in the analysis, may be edited if not correct
- Specifications: the LSL, nominal, and USL; at least one specification is required
- Show Options: selecting this button shows the various options for the Non-Normal Process Capability SnapShot (see options below)
- Average, Shade, Limits Options
- Out of Control Tests
- Classes, Minimum
- Select OK to create the Non-Normal Process Capability SnapShot
- Select Cancel to exit the program
In the input screen above, there is a section titled “Select Distribution”. Selecting the arrow shows the available non-normal distributions:
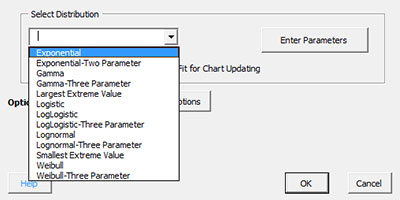
Select the distribution you want to use. If you are not sure which distribution fits best, you can run “Distribution Fitting” from the SPC for Excel ribbon. You can either choose to enter the parameters (if you have determined the parameters from distribution fitting) or let the program calculate the parameters. To enter the parameters, select the distribution you want (Gamma in this example) and select the “Enter Parameters” button. The screen below is displayed.
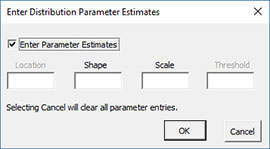
The name of the selected distribution is shown at the top. Select Enter Parameters and the parameters available for that distribution can be entered (shape and scale for the Gamma distribution). If you select Cancel, all parameters are cleared.
- 5. Once you have entered the information, select OK and the Non-Normal Process Capability SnapShot will be generated on a new chart sheet. An example based on the data above is shown below.
Options for the Non-Normal Process Capability SnapShot
On the input screen for the Non-Normal Process Capability SnapShot is the button labeled “Show Options”. If you select that button, the input screen will show the options. Each option is described below. It is not required to select any of these options.
Average, Shade, LImit Options
Selecting this option displays the input screen below. These options apply to the Ppk chart in the Non-Normal Process Capability SnapShot.
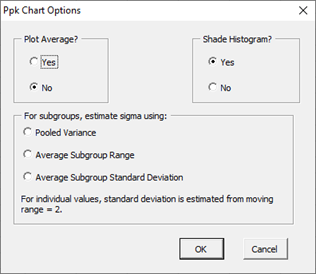
- Plot Average?: select Yes to plot the average; default is No
- Shade Histogram?: select Yes to shade the histogram; default is Yes
- For subgroups, estimate standard deviation using: for subgrouped data, there are three options: pooled variance, average subgroup range; or average subgroup standard deviation. If the average subgroup range is selected, the X-R control chart is used; if the average subgroup standard deviation or pooled variance is selected, the X-s control chart is used. For individual values, the Non-Normal X-mR control chart is used.
Out of Control Tests
Selecting this option displays the input screen below. These options apply to the control charts in the Non-Normal Process Capability SnapShot. This defines what out of control tests to apply to the control charts. The control charts used with the Non-Normal Process Capability SnapShot are X-R, X-s or Non-Normal X-mR charts. The screen below applies to the Non-Normal X-mR chart. If subgroups are used, the out of control tests are defined by those given in the Normal Process Capability SnapShot help.
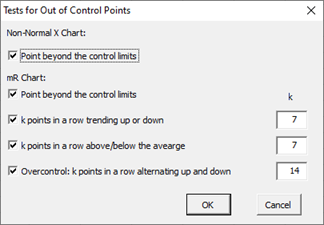
These options include:
- X Chart:
- Point beyond the control limits: out of control if a point that is above the upper control or below the lower control
- mR Chart:
- Point beyond the control limits
- k points in a row trending up or down
- k points in a row above or below the average
- Overcontrol: k points in row alternating up and down: out of control if k points in a row are such that the values alternate up and down
Classes, Minimum
If you select the “Classes, Minimum” option, the following input screen will appear:
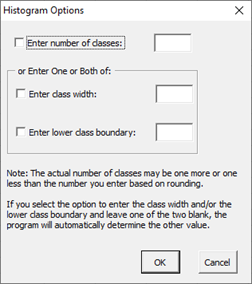
- Enter number of classes: this option sets the number of classes (bars) on the histogram
- Enter class width: this option changes the width of the classes (bars)
- Enter lower class boundary: this option sets the lower boundary on the histogram
- Select OK to use selected options
- Select Cancel to revert to previous options