Normal Process Capability SnapShot Help
Home » SPC for Excel Help » Process Capability Help » Normal Process Capability SnapShot Help
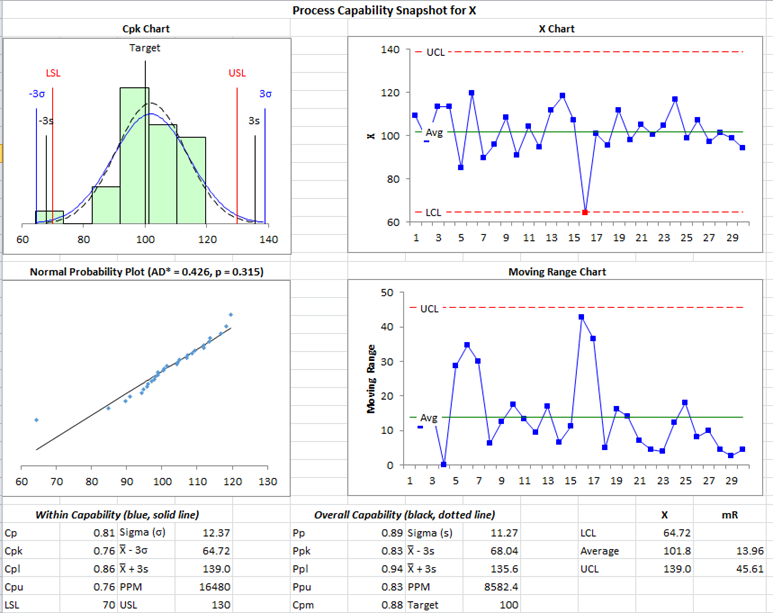
The Normal Process Capability SnapShot technique provides a “snapshot” in time of your process capability. The “snapshot” includes these four items:
- Cpk (process capability) Chart: used to determine how well your process meets specifications; includes the histogram, the specifications, the normal curve and the +/- three sigma limits (based on the estimate sigma and/or the calculated standard deviation)
- Control Chart: used to determine if the process is in statistical control
- Normal Probability Plot: used to determine if the data are normally distributed
- Statistics: various metrics, such as Cpk, Ppk, Sigma, etc. to help understand the results in more detail.
This page shows you how to create the Normal Process Capability SnapShot using the data that can be downloaded at this link. This page contains the following:

Data Entry
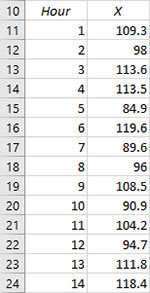
The data are entered into a worksheet as shown below (using the first part of the data into the example workbook). The data does not have to start in A1. It can be anywhere on the spreadsheet but must be in columns. Note: if the data are in columns, the program will assume that the number of columns is equal to the subgroup size. If the data are in three columns, a subgroup size of three is assumed in the calculations by the program.
Creating a Normal Process Capability SnapShot
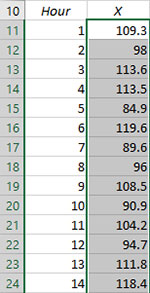
- 1. Select the data on the worksheet to be included in the analysis. If you have sample identifiers, like “Hour”below, do not select that data. You can also just put the cursor in the first cell of the data. The program will automatically select the data underneath that cell. If you select the title cell (given by X), it will be used as the variable’s name.
- 2. Select “SnapShot” from the “Process Capability” panel on the SPC for Excel ribbon.
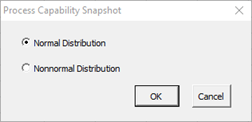
- 3. The form below is shown. Select “Normal Distribution” to generate the results for data that are normally distributed.
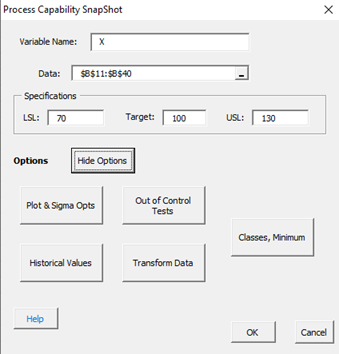
- 4. The input screen for the Normal Process Capability SnapShot is shown. The data range is the range the program will use for the analysis. You can edit the range if needed here.
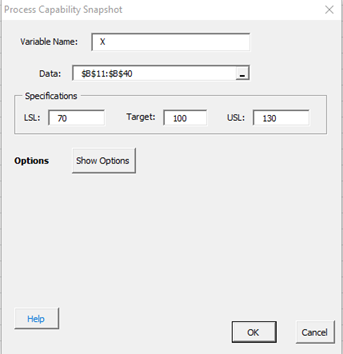
- Variable Name: the name of the data
- Data: range containing the data to use in the analysis, may be edited if not correct
- Specifications: the LSL, nominal, and USL; at least one specification is required
- Show Options: selecting this button shows the various options for the Normal Process Capability SnapShot (see options below)
- Plot & Sigma Options
- Out of Control Tests
- Historical Values
- Transform Data
- Classes, Minimum
- Select OK to create the Normal Process Capability SnapShot
- Select Cancel to exit the program
- 5. Once you have entered the information, select OK and the Process Capability SnapShot will be generated on a new chart sheet. An example based on the data above is shown below.
Options for the Normal Process Capability SnapShot
On the input screen for the Normal Process Capability SnapShot is the button labeled “Show Options”. If you select that button, the input screen will show the options. Each option is described below. It is not required to select any of these options.
Plot & Sigma Opts
Selecting this option displays the input screen below. These options apply to the Cpk chart in the Normal Process Capability SnapShot.
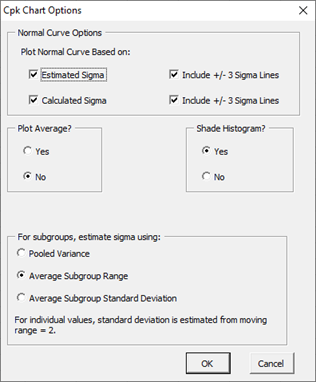
- Normal Curve Options: Plot Normal Curve Based on:
- Estimated Sigma (with option to include the +/- 3 sigma lines based on the estimated standard deviation from the range chart)
- Calculated Sigma (with option to include the +/- 3 sigma lines based on the calculated standard deviation)
- Default is to plot both curves but not either of the +/- 3 sigma lines
- Plot Average?: select Yes to plot the average; default is No
- Shade Histogram?: select Yes to shade the histogram; default is Yes
- For subgroups, estimate standard deviation using: for subgrouped data, there are three options: pooled variance, average subgroup range; or average subgroup standard deviation; for individuals data, the standard deviation is estimated from the moving range of 2. If the average subgroup range is selected, the X-R control chart is used; if the average subgroup standard deviation or pooled variance is selected, the X-s control chart is used. For individual values, the X-mR control chart is used.
Out of Control Tests
Selecting this option displays the input screen below. These options apply to the control charts in the Normal Process Capability SnapShot. This defines what out of control tests to apply to the control charts. The control charts used with the Normal Process Capability SnapShot are X-R, X-s or X-mR charts.
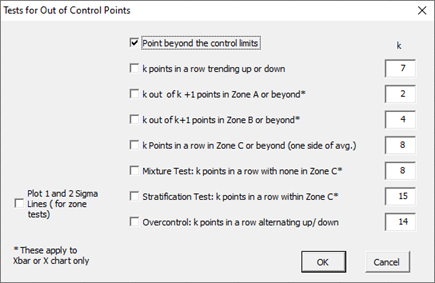
These options include:
- Point beyond the control limits: out of control if a point that is above the upper control or below the lower control
- k points in a row trending up or down: out of control if there are k points in a row trending upward or trending downward; two points in a row that are equal break this trend
- k out of k+1 points in Zone A or beyond: Zone A is two standard deviations of what is being plotted above the average and below the average
- k out k+1 points in Zone B or beyond: Zone B is one standard deviation of what is being plotted above the average and below the average
- k points in a row in Zone C or beyond (one side of avg): Zone C is the zone between the average and one standard deviation above the average on the top half of the chart and the average and one standard deviation below the average on the bottom half of the chart; out of control if there is a run of k points in a row above or below the average
- Mixture Test: k points in a row with none in Zone C: out of control if there are k points in a row not in Zone C on either side of the average
- Stratification Test: k points in a row within Zone C: out of control if there are k points in a row in Zone C on either side of the average
- Overcontrol: k points in row alternating up and down: out of control if k points in a row are such that the values alternate up and down
- Plot 1 and 2 Sigma Lines (for zone tests): select this option to plot the 1 and 2 sigma lines on the chart; this option is overridden by the option to add two additional lines on the Control Limits Options.
Note: only four tests apply to the R chart:
- Point beyond the control limits
- k points in a row trending up or down
- k points in a row in Zone C or beyond (one side of avg)
- Overcontrol: k points in row alternating up and down: out of control if k points in a row are such that the values alternate up and down
Historical Values
Selecting this option displays the input screen below.
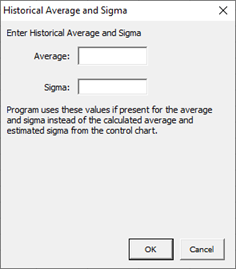
- Enter Historical Average and Sigma: option to enter an average and sigma; if entered the program uses these values instead of the calculated average and estimated standard deviation from the range chart. These apply to the control chart only and are not used in the normal probability plot.
Transform Data
You have the option to transform the data either with the Box-Cox or Johnson Transformations. Selecting this option displays the input screens shown below. If you select the “Transform the Data” option, you will have the option to select either the Box-Cox or the Johnson Transformations. Selecting the Box-Cox option displays this input screen.
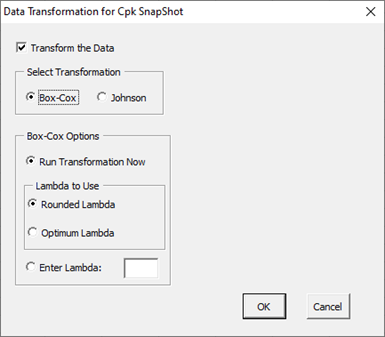
- Run Transformation Now: performs the Box-Cox transformation
- Lambda to Use: option to use either the rounded lambda or the optimum lambda
- Enter Lambda: enter the lambda you want to use for the transformation
Selecting the Johnson Transformation displays the input screen below.
- Run Transformation Now: performs the Johnson transformation
- Use Transformation Below: option to enter the distribution and parameters
- Distribution: the distribution to use: SB, SL, SU
- ?, ?, ?, ?: the parameters used with the Johnson distribution
Classes, Minimum
If you select the “Classes, Minimum” option, the following input screen will appear:
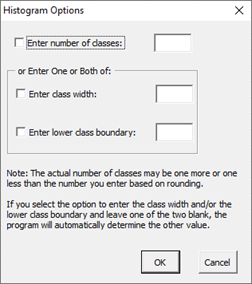
- Enter number of classes: this option sets the number of classes (bars) on the histogram
- Enter class width: this option changes the width of the classes (bars)
- Enter lower class boundary: this option sets the lower boundary on the histogram
- Select OK to use selected options
- Select Cancel to revert to previous options