Descriptive Statistics Help
Home » SPC for Excel Help » Statistical Tools » Descriptive Statistics Help
SPC for Excel will generate descriptive statistics for one or more sets of data. There is the option to include a dot plot and histogram for each set of data.
Example
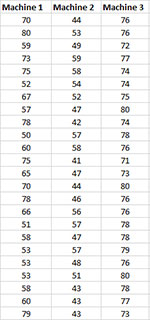
You want to get a quick overview of the performance of three machines. The data you have collected are shown below.

- 1. Enter the data into a worksheet as shown below. The data can be downloaded at this link. The data must be in columns. The first cell in each column range must contain the heading. The number of data points in each column can vary. The maximum number of data sets is 125 if you are going to construct a dot plot.
- 2. Select the headings and data (shaded in blue above).
- 3. Select “Desc. Stats” from the “Statistical Tools” panel in the SPC for Excel ribbon.
- 4. Fill in the Descriptive Statistics input form.
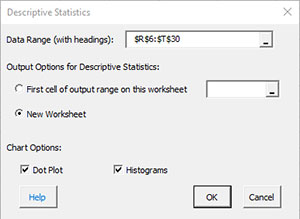
- Data Range (with headings): Enter the worksheet range containing data with headings in the first cell of the column range; default range is the range selected on the worksheet
- Output Options for Descriptive Statistics: You have the options to place the descriptive results on a new worksheet (the default) or in the current worksheet.
- Dot Plot: This option creates the dot plot for each variable; default is checked
- Histograms: This option creates a histogram for each variable; default is checked.
- Select OK and the program will generate the results.
- Select Cancel to end the program.
Descriptive Statistics Output
The output for the descriptive statistics is shown below.
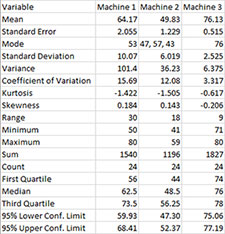
The standard error is the standard deviation divided by the square root of the sample size (count). The 95% upper and lower confidence intervals are calculated from the t distribution as the average +/- t(standard error) where t is the value of the t distribution for alpha = 0.05 and the degrees of freedom associated with the sample size.
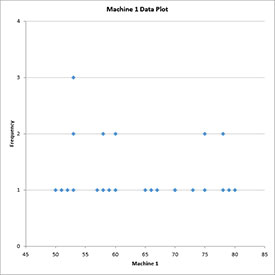
If the option for the dot plot and/or histogram was selected, the charts are placed on a new worksheet. All the charts for each variable are placed on that worksheet. The dot plot for Machine 1 is shown below. The frequency for each data value is given on the y axis.
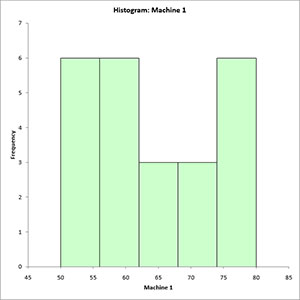
The histogram for Machine 1 is shown below.