Chi Square Test for Association
Home » SPC for Excel Help » Statistical Tools » Miscellaneous Tools Help » Chi Square Test for Association
The Chi-Square Test for Association is used to determine if there is any association between two variables. It is really a hypothesis test of independence. The null hypothesis is that the two variables are not associated, i.e., independent. The alternate hypothesis is that the two variables are associated. The example below shows how to do this test using the SPC for Excel software (from Statistics and Data Analysis, by Ajit Tamhane and Dorothy Dunlop, Prentice-Hall, 2000).

A survey was done to determine if job satisfaction was related to income. A total of 901 people participated in the survey. The data are shown below. We will use the Chi-Square Test for Association to determine if the two variables are associated.
- 1. Enter the data into an Excel worksheet as shown below.
| Income | Very Dissatisfied | Little Dissatisfied | Moderately Satisfied | Very Satisfied |
|---|---|---|---|---|
| <6000 | 20 | 24 | 80 | 82 |
| 6000 – $15000 | 22 | 38 | 104 | 125 |
| 15000 – 25000 | 13 | 28 | 81 | 113 |
| >25000 | 7 | 18 | 54 | 92 |
- 2. Select all the data in the table above including the headings.
- 3. Select “Misc. Tools” from the “Statistical Tools” panel on the SPC for Excel ribbon.
- 4. Select the “Chi Square Test for Association” option and then OK.
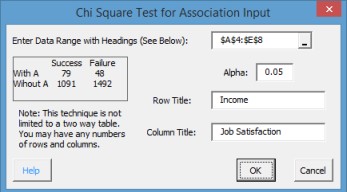
- Enter Data Range with Labels: enter the range containing the data and the labels; default is the range selected on the worksheet.
- Alpha: this is the confidence level; 1-alpha is the confidence interval. Default is 0.05 for 95% confidence.
- Row Title: Enter the title of the rows; default is value in first row of selected data.
- Column Title: enter the title of the columns; default is value in row above second column.
- Select OK to generate the results.
- Select Cancel to end the program.
Chi Square Test for Association Output
The output from the Chi-Square Test for Association is shown below. An explanation of the output follows.
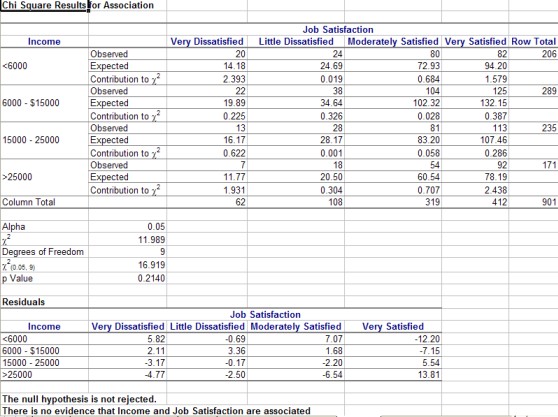
The top part of the output contains the data with the observed and expected values as well as the contribution of each to χ2. The row and column totals are also given.
The middle portion of the output contains the following:
- Alpha (entered)
- The calculated χ2
- The degrees of freedom
- The critical χ2 value based on alpha and the degrees of freedom
- The calculated p value (will be in red if ≤ alpha)
The bottom portion of the output contains the residuals. The residuals are the difference between the observed and the expected values. The conclusion is then given based on the values of alpha and the p value. The null hypothesis (that the variables are not associated) is rejected if the p value < alpha.