Item Analysis Help
Home » SPC for Excel Help » Statistical Tools » Miscellaneous Tools Help » Item Analysis Help
The Item Analysis procedure is a method of testing how reliable the questions are on a survey. The program uses Cronbach’s Alpha, the Pearson correlation matrix, and the scatter plot matrix to perform the item analysis. An example of the Item Analysis procedure is given below.

Example
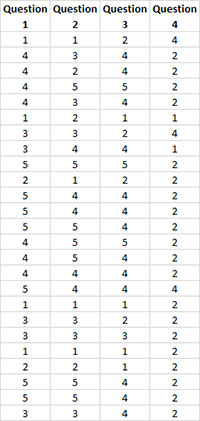
You have a four question survey that measures customer satisfaction. You want to know if the questions are reliable – do they all measure the same thing? The questions use the Likert Scale rating of 1 to 5, with 5 representing the highest satisfaction. You would expect a customer who is satisfied to rate the four questions similarly. The results from 25 customers are shown in the table below.
- 1. Enter the results in a worksheet as shown below. The data can be downloaded at this link. The data must be in adjacent columns. The first cell in each column range must contain the item name. Each row represents the response of one person for the item.
- 2. Select all the data in the table above including the headings.
- 3. Select “Misc. Tools” from the “Statistical Tools” panel on the SPC for Excel ribbon.
- 4. Select the “Item Analysis” option and then OK.
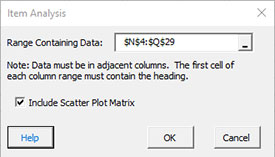
- Range Containing Data: enter the range containing the data and headings; default is the range selected on the worksheet.
- Include Scatter Plot Matrix: check to generate the scatter plots; default is “Yes.”
- Select OK to generate the results.
- Select Cancel to end the program.
Item Analysis Output
There is at least one worksheet added to your workbook. This one gives the numerical results. If you selected the Scatter Plot Matrix option, a second sheet with the scatter plot matrix results is added.
Numerical Results
The output for the example data are shown in the table below.
Item Statistics
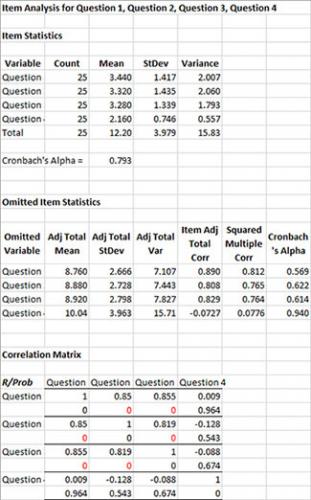
This portion of the worksheet provides the summary statistics for each item (question in this example). The number (count), the mean, the standard deviation and variance are given. Cronbach’s alpha for all the results is then given. This single number is an indication of how well a set of items (or questions) measure a certain characteristic (like customer satisfaction). Cronbach’s alpha varies between 0 and 1 (although negative values are possible but have no meaning). Values of 0.7 are considered acceptable. In this example, the overall Cronbach alpha is 0.793 – which appears acceptable but you need to look at the Omitted Item Statistics.
Omitted Item Statistics
This portion of the worksheet gives the results when each item is removed from the data set. The “adjusted” mean, standard deviation and variance are the results when that item is not in the data. There are three additional calculations in this portion of the worksheet:
- Item Adj. Total Corr: This is the correlation between the scores of one omitted item and the total score of all other items. If one item has a much lower value than the others, then it may not be measuring what the rest of the items are. Question 4 has a low Item Adj. Total Correlation when compared to the other three.
- Squared Multiple Corr – This is the R Squared value when the omitted item is regressed on the remaining items. If one item has a much lower value than the others, then it may not be measuring what the rest of the items are. Question 4 has a lower R Squared value when compared to the other three.
- Cronbach’s Alpha – Calculated after an item is omitted from the analysis. When question 4 is omitted, the value of Cronbach’s alpha increases significantly. This indicates that question 4 is not reliable and should be removed from the analysis.
Correlation Matrix
This portion of the worksheet measures the inter-item correlation coefficient (R). The items should be highly correlated if they are measuring the same characteristic. Values close to 1 represent highly correlated values. The probability of the correlation being significant is also given. If the probability is less than 0.05, the probability is in red. This means that there is statistically significant correlation between the two items. As a rule of thumb, if the probability is greater than 0.20, there is not a correlation between the two items. Values between 0.05 and 0.20 need more data before a conclusion can be reached. Question 4 does not correlate with any other results; again this indicates that question 4 is not reliable.
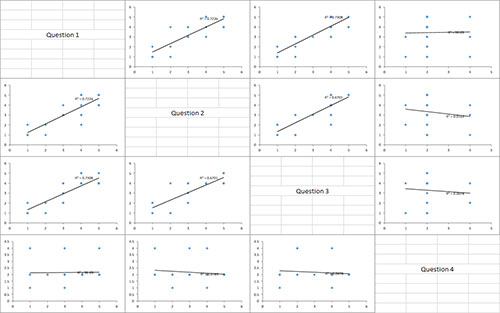
If the scatter plot matrix option was selected, the scatter plots for each pair of items is generated. This provides a visual picture of the results in the correlation table. The results for this example are shown below. Each scatter chart contains the best fit line and value of squared. You can see that the best fit lines for those charts involving Question 4 are not as steep as the others – indicating a lack of correlation.